
Reports, Reporting for Duty
At Maurer-Stutz Geospatial Services, we have many projects that require reporting. Today, we want to help other ArcGIS Pro users utilize the reporting functions built within that system in an easy and effective way.
Utilizing ArcGIS Reports
At Maurer-Stutz Geospatial Services, we have many projects that require reporting. Today, we want to help other ArcGIS Pro users utilize the reporting functions built within that system in an easy and effective way.
The Reports function allows you to quickly generate a report from your data. You can:
Display only the fields you specify for each feature.
Add visual elements like graphs and charts.
Filter the data to show only what’s relevant to the purpose of the report.
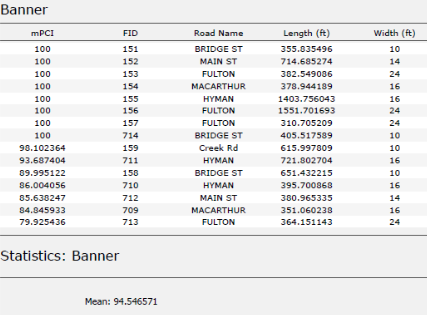
In this example, I used road assessment data as my source, and wanted to create a report showing me each road across 11 different towns, sorted from worst to best based on their score (mPCI).
Step 1: Select Your Data
Select the map frame that contains the data you want to use.
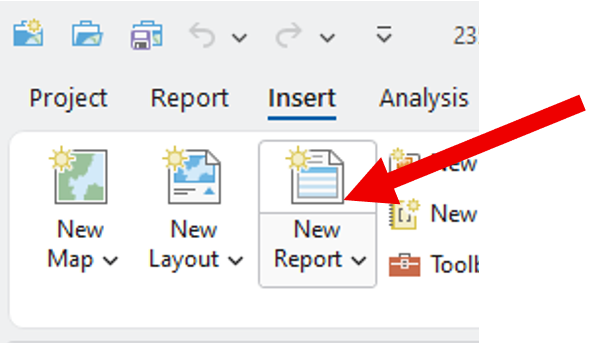
Go to the Insert tab and click New Report.
Step 2: Choose a Template
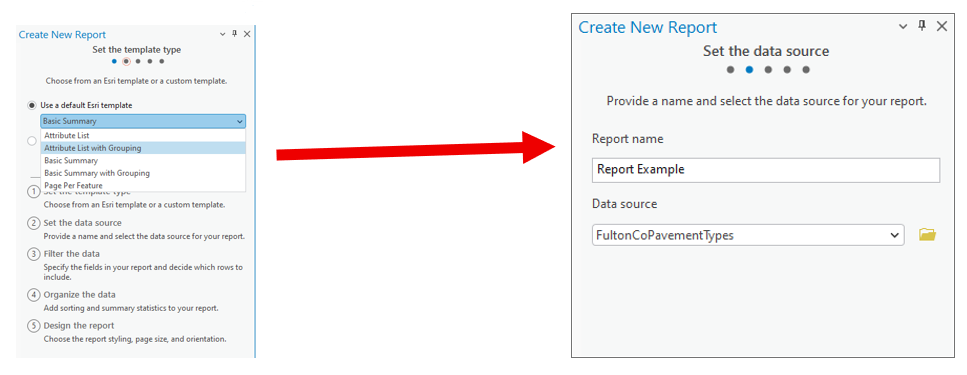
Select a report template.
Example: Choose Attribute List with Grouping.Name your report.
Select the data source (the dataset you’ll report on).
Step 3: Organize the Data
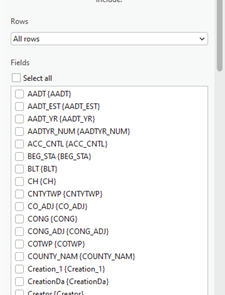
Choose the fields you want to display.
Example: For a road assessment, include:Road Name
Assessment Score
Length
Width
Material
Other relevant details
Tip: Drag and drop fields to reorder them in the report.
2. Select a grouping field to organize your report.
Example: Group by Municipality.
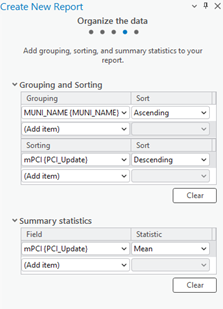
3. Define sorting rules within each group.
Example: Sort roads by Assessment Score (descending),
so the lowest scores appear first.
4. (Optional) Add group statistics:
Choose a field (e.g., Assessment Score).
Select a statistic (e.g., Mean) to summarize each group.
5. Set your page size and click Finish.
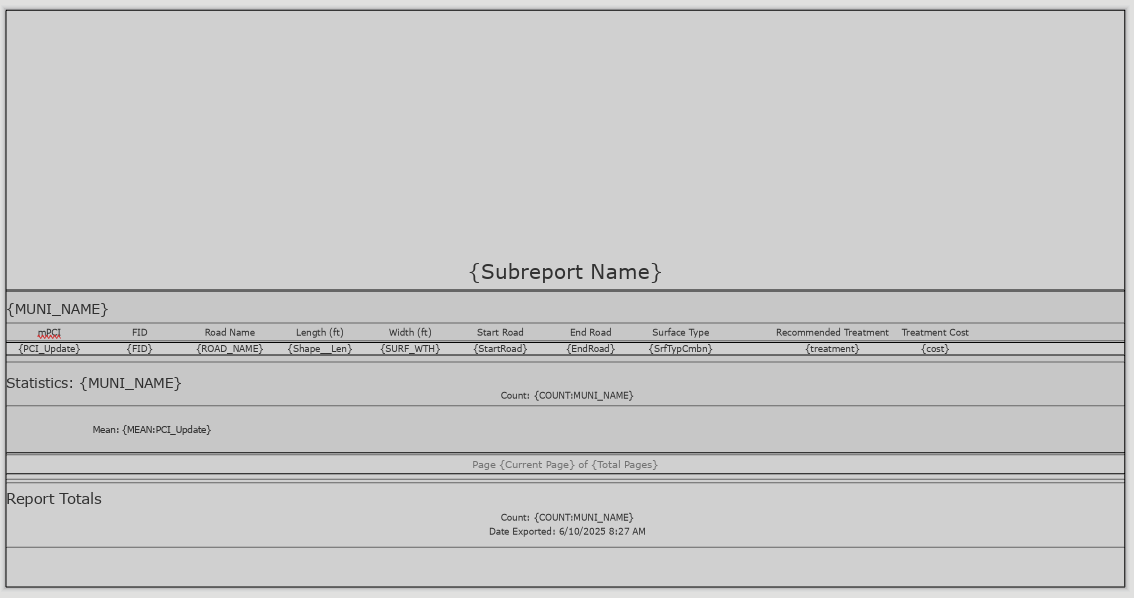
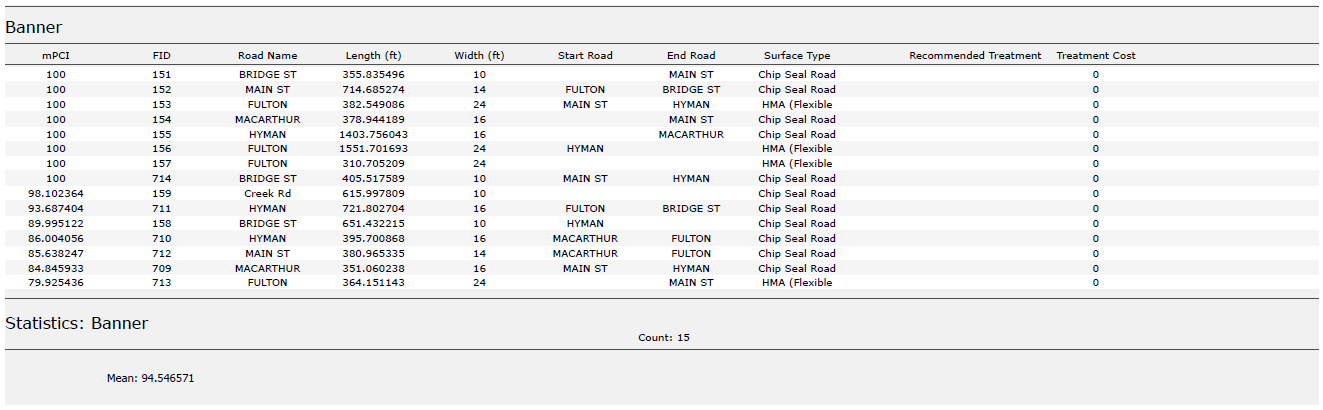
Step 4: Preview the Report
Your report will now display:
Each road grouped by municipality.
Roads within each group sorted by assessment score.
You can rename column headers to make them more readable.
(Just like editing text in Layout View.)
Step 5: Export the Report
Export the report as a PDF or another supported format.
Your final report will include:
Organized, grouped, and sorted data.
Optional charts, statistics, or summary sections if added.
Additional Tips
Use the Insert tab to:
Add more fields or statistics after the report has been created.
Insert charts, dynamic images, or text blocks.
Choose where these additions appear:
Statistics Group: Appears at the end of each group (e.g., each municipality).
Report Totals: Appears at the very end of the full report.
We hope this has been a casual guide to creating reports in ArcGIS. It walks you through generating a report from your data, showing you how to pick what information to display, add visuals like graphs and charts, and filter what's relevant. You'll learn how to select your data, choose a template, organize your information by grouping and sorting, preview your report, and finally, export it as a PDF or other format. There are also some neat tricks for customizing your report, like adding more fields or charts after it's been created
If you have other questions please don’t hesitate to contact us in the form below.

Shared Update is Shared Administration
Here’s the setup: You’ve carefully crafted a web map and application in ArcGIS Online. The data is perfect, the configurations are solid, and you’re ready to share it with your team. But then, you notice something alarming — edits are possible when they shouldn’t be. Despite your best efforts to lock things down, the data is still editable in ways you may not want. This was the exact situation we faced recently. Here’s how we untangled the mystery and discovered (via tech support) a hidden pitfall in group permissions that every ArcGIS Online user should know about.
Geospatial > The Layer File > Shared Update is Shared Administration
Preventing Unwanted Edits in ArcGIS Online: A Support Case Story
Here’s the setup: You’ve carefully crafted a web map and application in ArcGIS Online. The data is perfect, the configurations are solid, and you’re ready to share it with your team. But then, you notice something alarming — edits are possible when they shouldn’t be. Despite your best efforts to lock things down, the data is still editable in ways you may not want.
This was the exact situation we faced recently. Here’s how we untangled the mystery and discovered (via tech support) a hidden pitfall in group permissions that every ArcGIS Online user should know about.
It’s right there! Just click it!
The Puzzle Begins
Our journey started with two accounts: an admin account and a creator role responsible for Editing ATTRIBUTES of a hosted feature layer in an Experience Builder application. Our goal was simple:
Welp. That’s not supposed to happen….
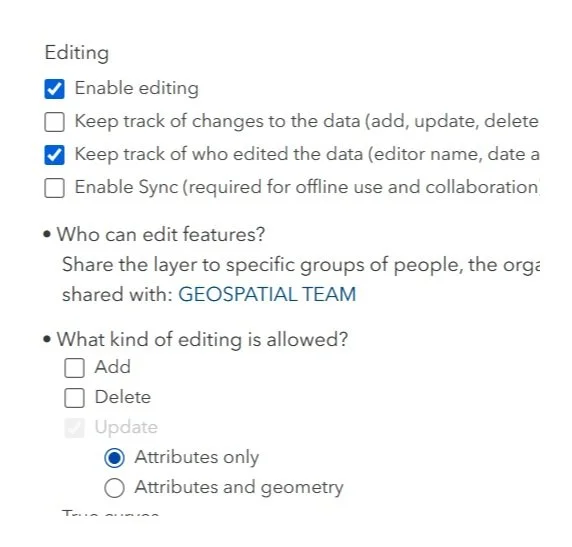
Prevent Geometry Changes except for the admin or data owner. No sweat right? Just set that variable in the Feature layer’s settings. Done- Duh.
Except, after using the Admin to set that option , my Creator user could still add, delete and change the geometry.
We double-checked everything:
Just for fun, we totally disabled editing in the hosted feature layer settings — check.
The Experience Builder edit widget was configured to prevent edits — check.
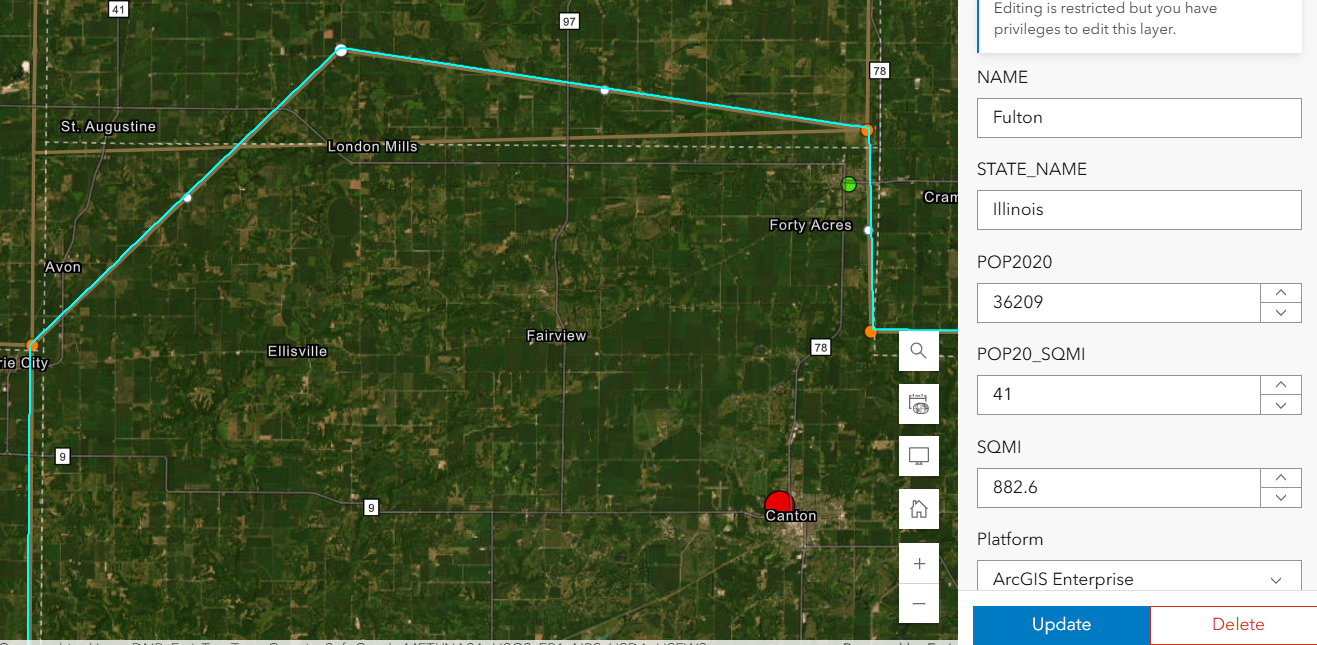
Yet, somehow, edits were still possible. It didn’t make sense. We were sure we had all the right settings in place, but the problem persisted. The Creator user could edit vertices in the webmap AS WELL AS resize polygons in the Experience Builder application. In fact that Creator user could change these settings as well as add fields or enable attachments on a layer it did not own.
Digging Deeper
After some thorough troubleshooting with Esri Tech Support, the only commonality was that the users were both a part of the same group. The web map, app, and layers were all shared with this group — a shared update group, to be exact.
For those unfamiliar, shared update groups are powerful collaboration tools in ArcGIS Online. They allow multiple people to edit items shared within the group. However, with great power comes great responsibility (and a potential for unintended consequences).
Esri’s documentation on creating groups carries this important caution:
Caution: A shared update group allows all members to edit items shared with the group. Be careful when enabling this capability, as it overrides individual item settings for editing. …members of this group also have elevated privileges, such as the ability to edit the contents of hosted feature layers, append and update a hosted feature layer using the content of a file, alter editor tracking settings, enable or disable attachments, and alter the layer's schema.

Despite our feature layer and widget settings, the shared update group’s permissions were overriding everything, allowing geometry edits to slip through. The fact that the setting disallows adding, deleting, or changing geometry, means nothing. The layer being shared with a ‘shared update’ group overrides ALL those settings!
Finding the Solution
With this realization, the path forward became clear. We needed to change how we were sharing the content. Here’s what we did:
Created a new group without shared update privileges.
Shared the web map and app with this new group instead.
Tested it — and this time, with the same user, no unwanted geometry edits!
By removing the shared update capability, we ensured that only the admin or data owner could make changes. The issue was finally resolved.
This experience highlighted an important lesson about managing permissions in ArcGIS Online:

Shared update groups are powerful but can lead to unintended edits. If you don’t need collaborative editing, avoid using shared update groups. Stick to regular groups to keep your content secure.
Taking a moment to review your group settings can save you from unexpected headaches. It’s a subtle but critical detail that can make all the difference in protecting your data.
In the world of geospatial data, collaboration is essential, but so is control. Understanding how permissions work — and how group settings can override individual item configurations — is key to successful content management in ArcGIS Online. Next time you set up a web map or app, ask yourself: Who really needs editing privileges?
Choose your groups wisely, and your data will stay secure.