
Reports, Reporting for Duty
At Maurer-Stutz Geospatial Services, we have many projects that require reporting. Today, we want to help other ArcGIS Pro users utilize the reporting functions built within that system in an easy and effective way.
Utilizing ArcGIS Reports
At Maurer-Stutz Geospatial Services, we have many projects that require reporting. Today, we want to help other ArcGIS Pro users utilize the reporting functions built within that system in an easy and effective way.
The Reports function allows you to quickly generate a report from your data. You can:
Display only the fields you specify for each feature.
Add visual elements like graphs and charts.
Filter the data to show only what’s relevant to the purpose of the report.
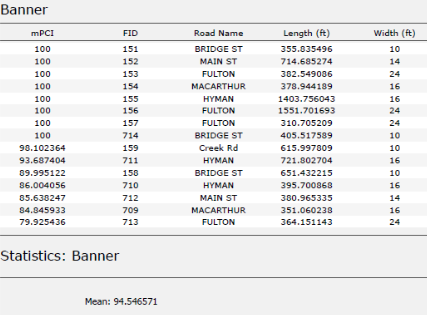
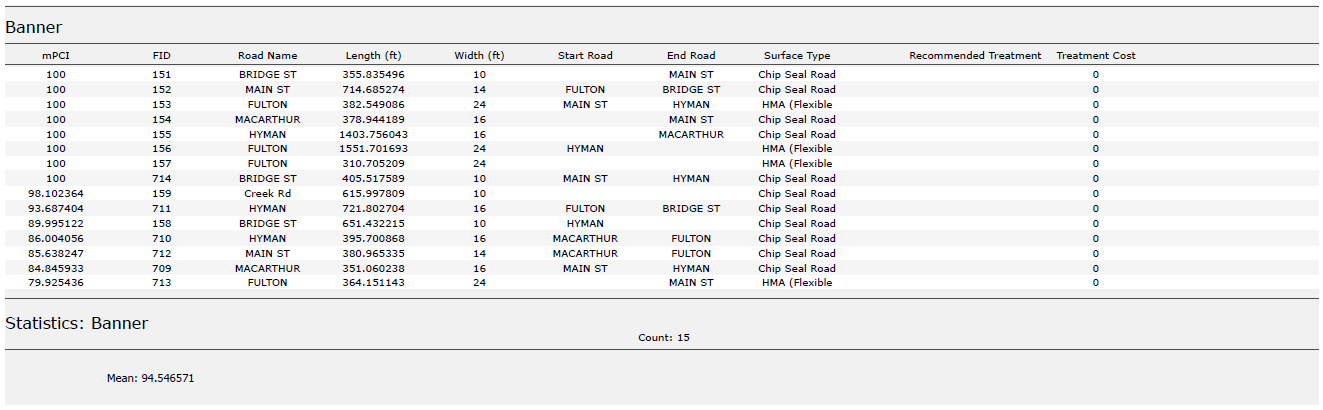
In this example, I used road assessment data as my source, and wanted to create a report showing me each road across 11 different towns, sorted from worst to best based on their score (mPCI).
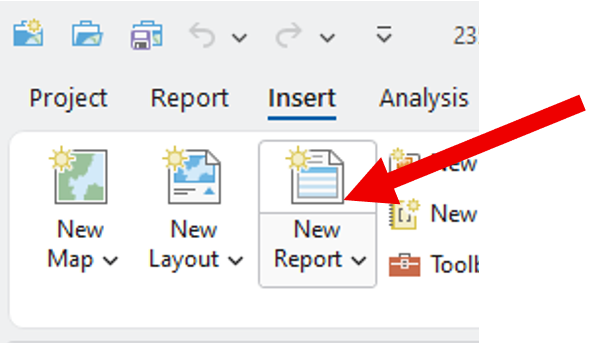
Step 1: Select Your Data
Select the map frame that contains the data you want to use.
Go to the Insert tab and click New Report.
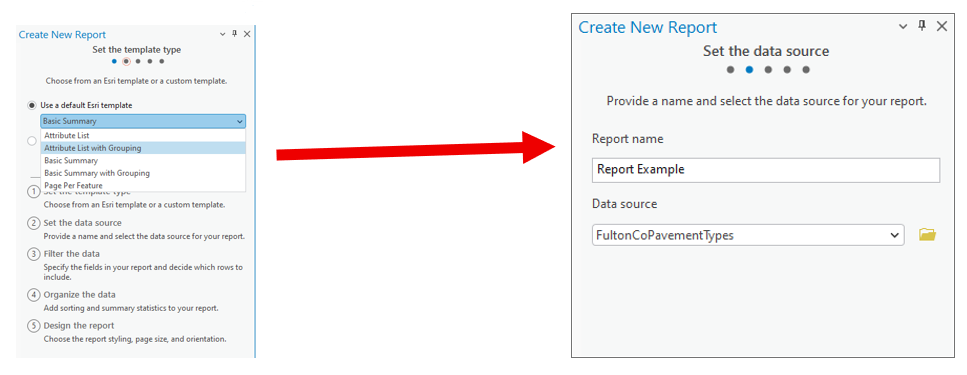
Step 2: Choose a Template
Select a report template.
Example: Choose Attribute List with Grouping.Name your report.
Select the data source (the dataset you’ll report on).
Step 3: Organize the Data
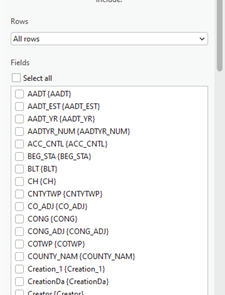
Choose the fields you want to display.
Example: For a road assessment, include:Road Name
Assessment Score
Length
Width
Material
Other relevant details
Tip: Drag and drop fields to reorder them in the report.
2. Select a grouping field to organize your report.
Example: Group by Municipality.
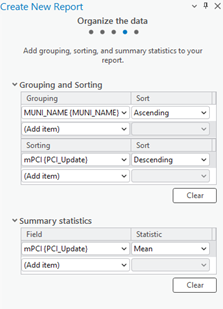
3. Define sorting rules within each group.
Example: Sort roads by Assessment Score (descending),
so the lowest scores appear first.
4. (Optional) Add group statistics:
Choose a field (e.g., Assessment Score).
Select a statistic (e.g., Mean) to summarize each group.
5. Set your page size and click Finish.
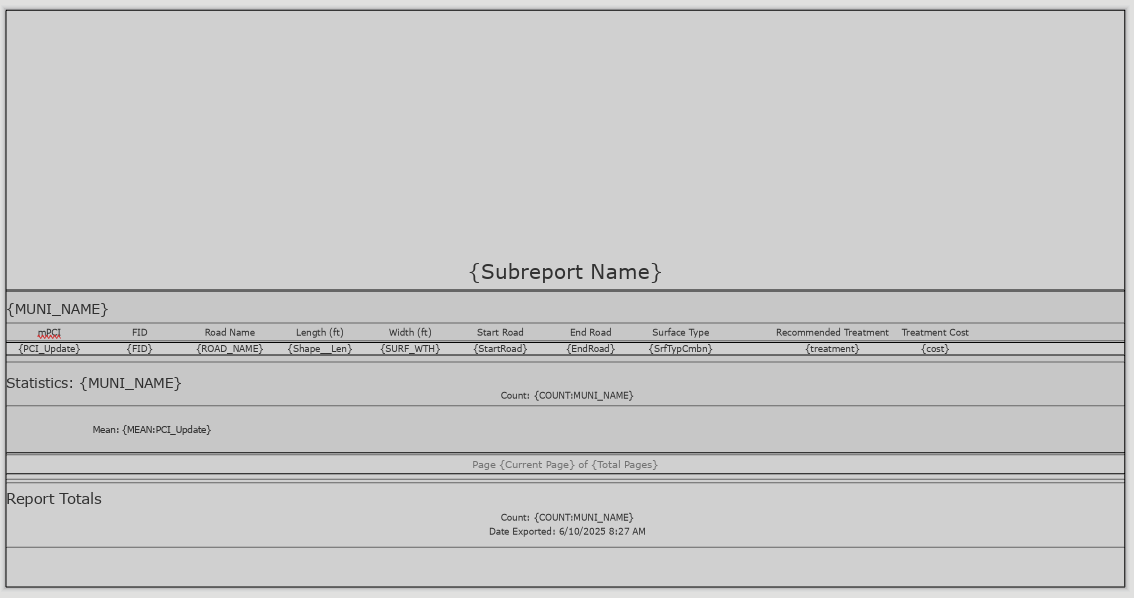
Step 4: Preview the Report
Your report will now display:
Each road grouped by municipality.
Roads within each group sorted by assessment score.
You can rename column headers to make them more readable.
(Just like editing text in Layout View.)
Step 5: Export the Report
Export the report as a PDF or another supported format.
Your final report will include:
Organized, grouped, and sorted data.
Optional charts, statistics, or summary sections if added.
Additional Tips
Use the Insert tab to:
Add more fields or statistics after the report has been created.
Insert charts, dynamic images, or text blocks.
Choose where these additions appear:
Statistics Group: Appears at the end of each group (e.g., each municipality).
Report Totals: Appears at the very end of the full report.
We hope this has been a casual guide to creating reports in ArcGIS. It walks you through generating a report from your data, showing you how to pick what information to display, add visuals like graphs and charts, and filter what's relevant. You'll learn how to select your data, choose a template, organize your information by grouping and sorting, preview your report, and finally, export it as a PDF or other format. There are also some neat tricks for customizing your report, like adding more fields or charts after it's been created
If you have other questions please don’t hesitate to contact us in the form below.
Mapping for a Cause
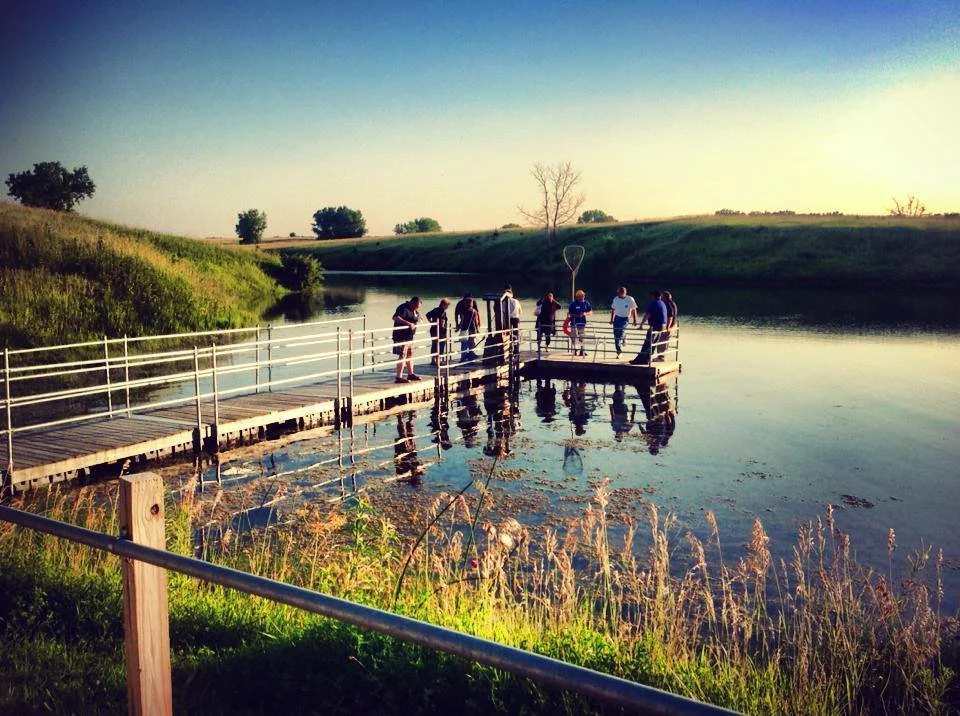
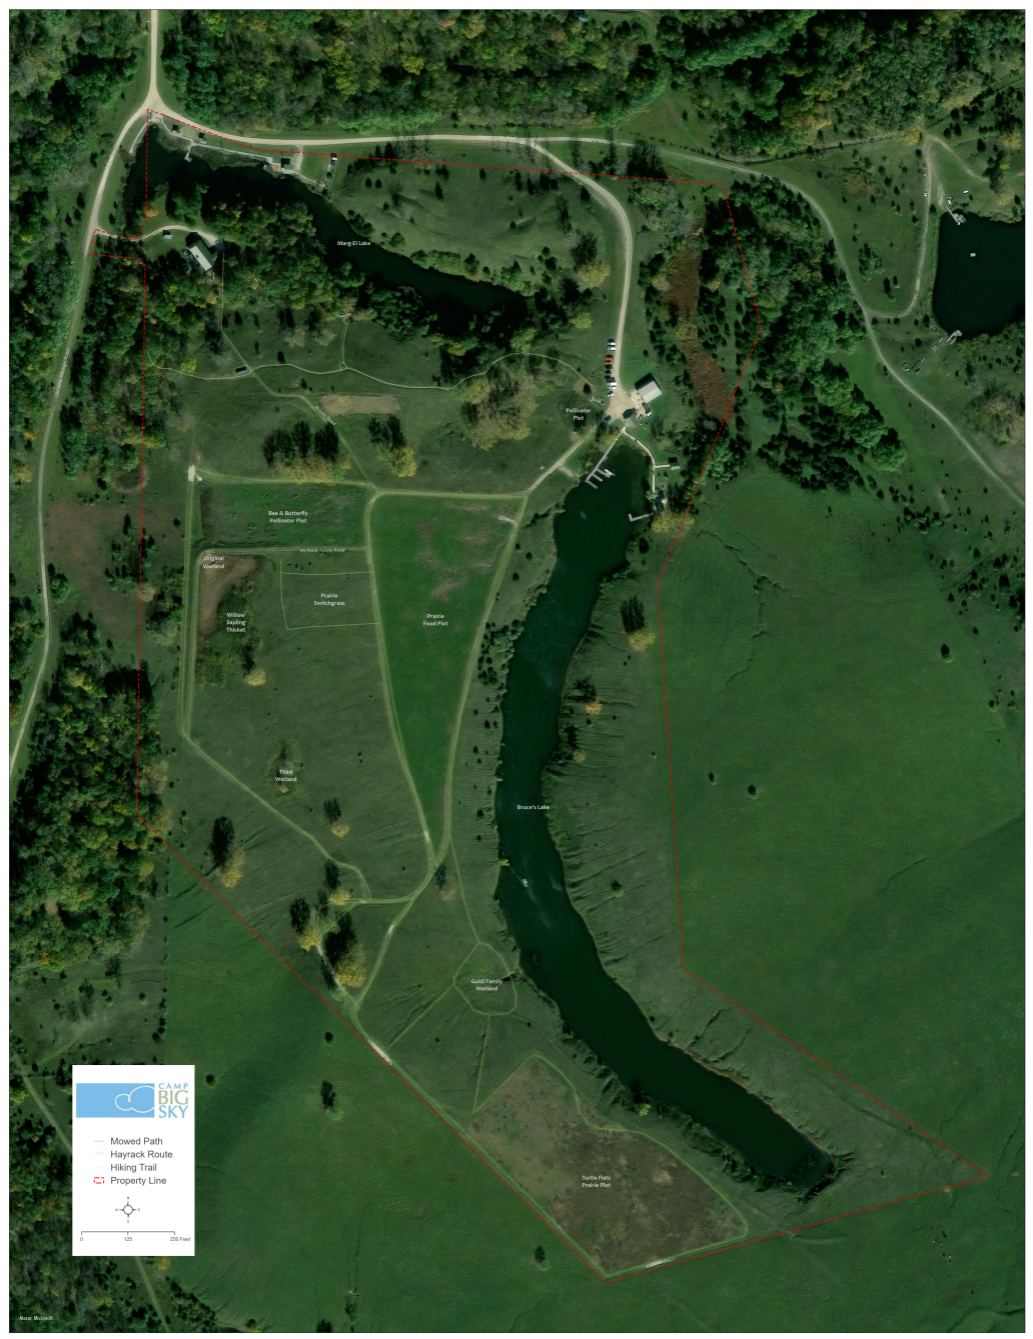
At Maurer-Stutz, Inc., we believe in using our expertise to give back to the community. One of our on-going relationships is with Camp Big Sky, a nonprofit in Fairview, IL, dedicated to providing outdoor experiences for individuals with disabilities.
Mapping for a Cause: Supporting Camp Big Sky with GIS
At Maurer-Stutz, Inc., we believe in using our expertise to give back to the community. One of our on-going relationships is with Camp Big Sky, a nonprofit in Fairview, IL, dedicated to providing outdoor experiences for individuals with disabilities.
“We’d Like a Map”
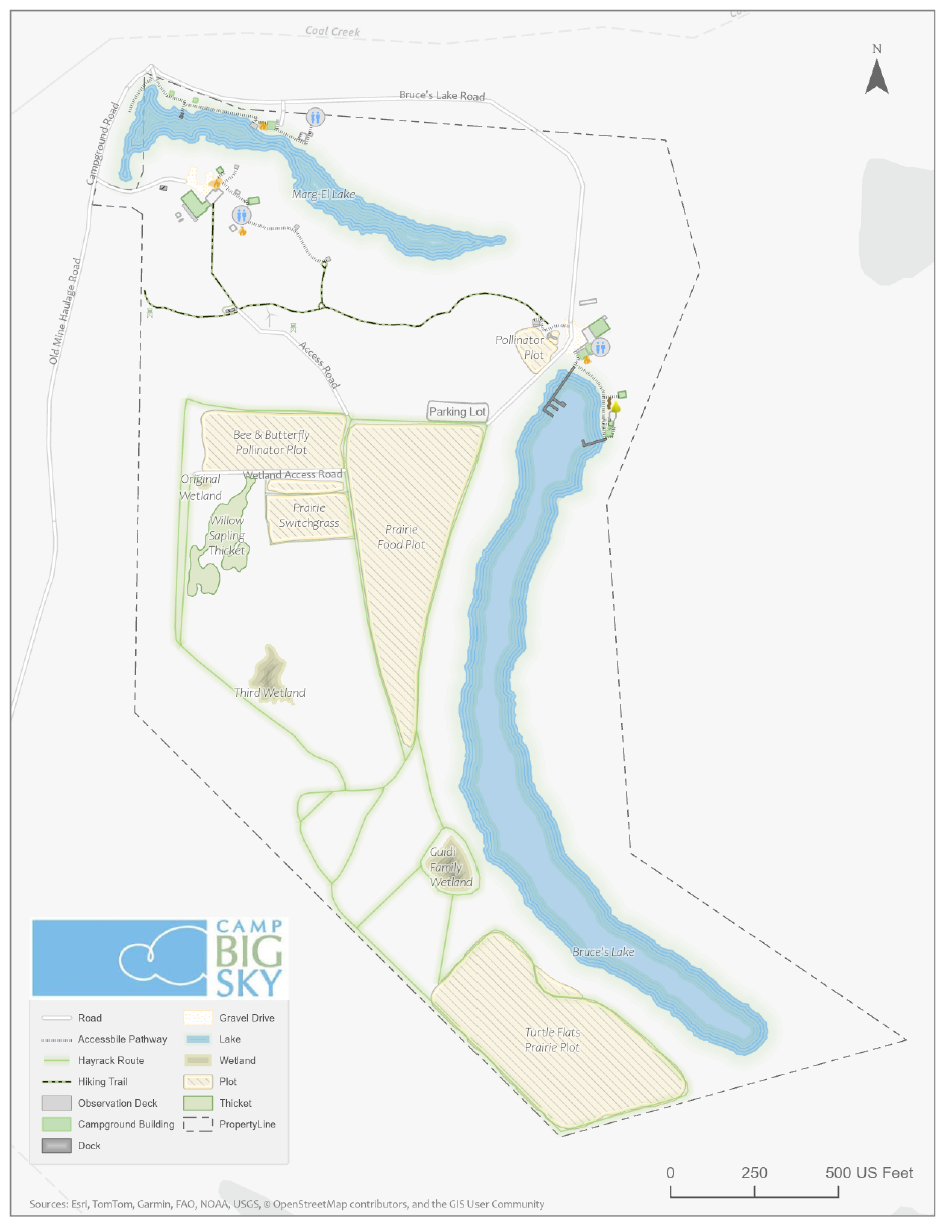
Camp Big Sky recently inquired about the possibility of having Mauer-Stutz Geospatial create a large display map to provide visitors with a clear overview of the camp - similar to maps found at theme parks or the beginning of a hiking trail. That request for a single map began a series of conversations.
Through our discussions with Camp Big Sky, a robust GIS solution developed allowing for the creation of a whole variety of customized maps. We discussed their need for duplicatable, day-use maps, maps specifically tailored for grant applications, online maps, etc.— all of which can easily be created from the GIS that was already being built!
How We’re Helping
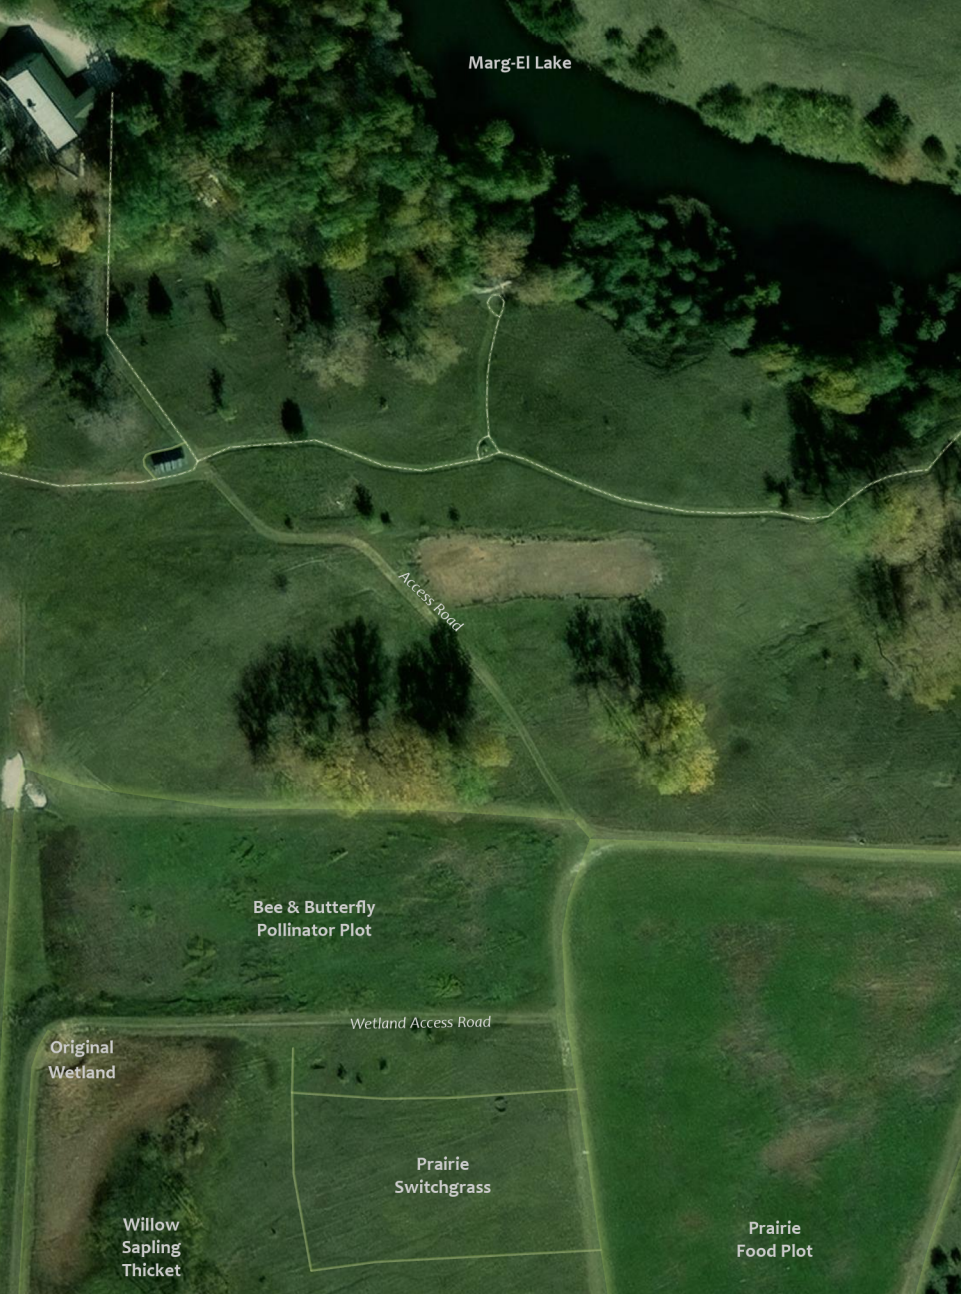
Using drone imagery, we captured high-resolution aerial views of the camp, allowing us to digitize important features with precision. This data forms the foundation of our maps, ensuring accuracy and detail.
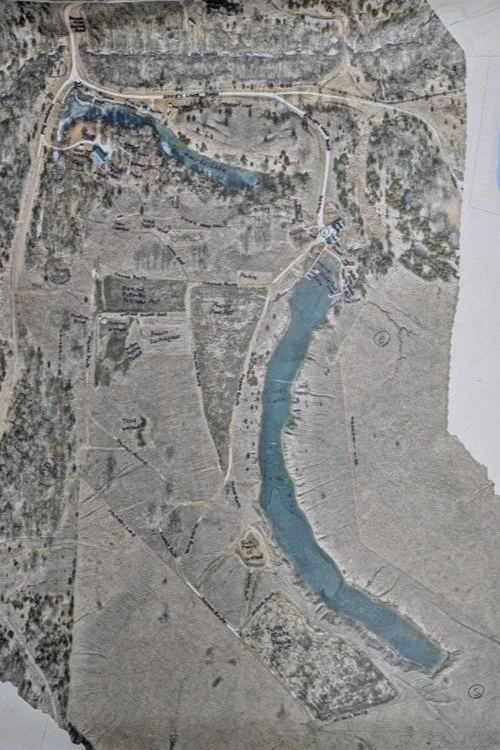
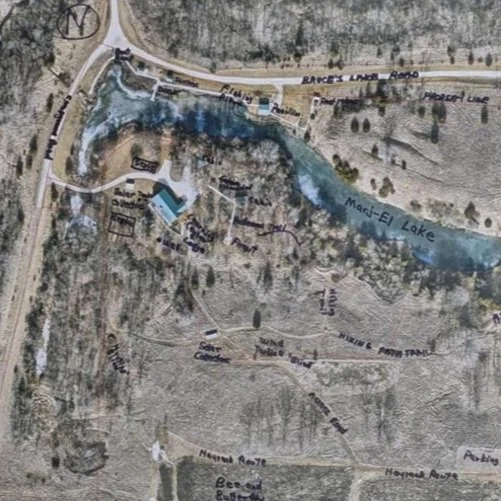
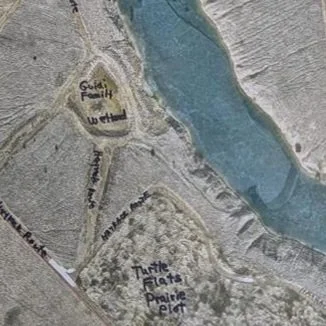
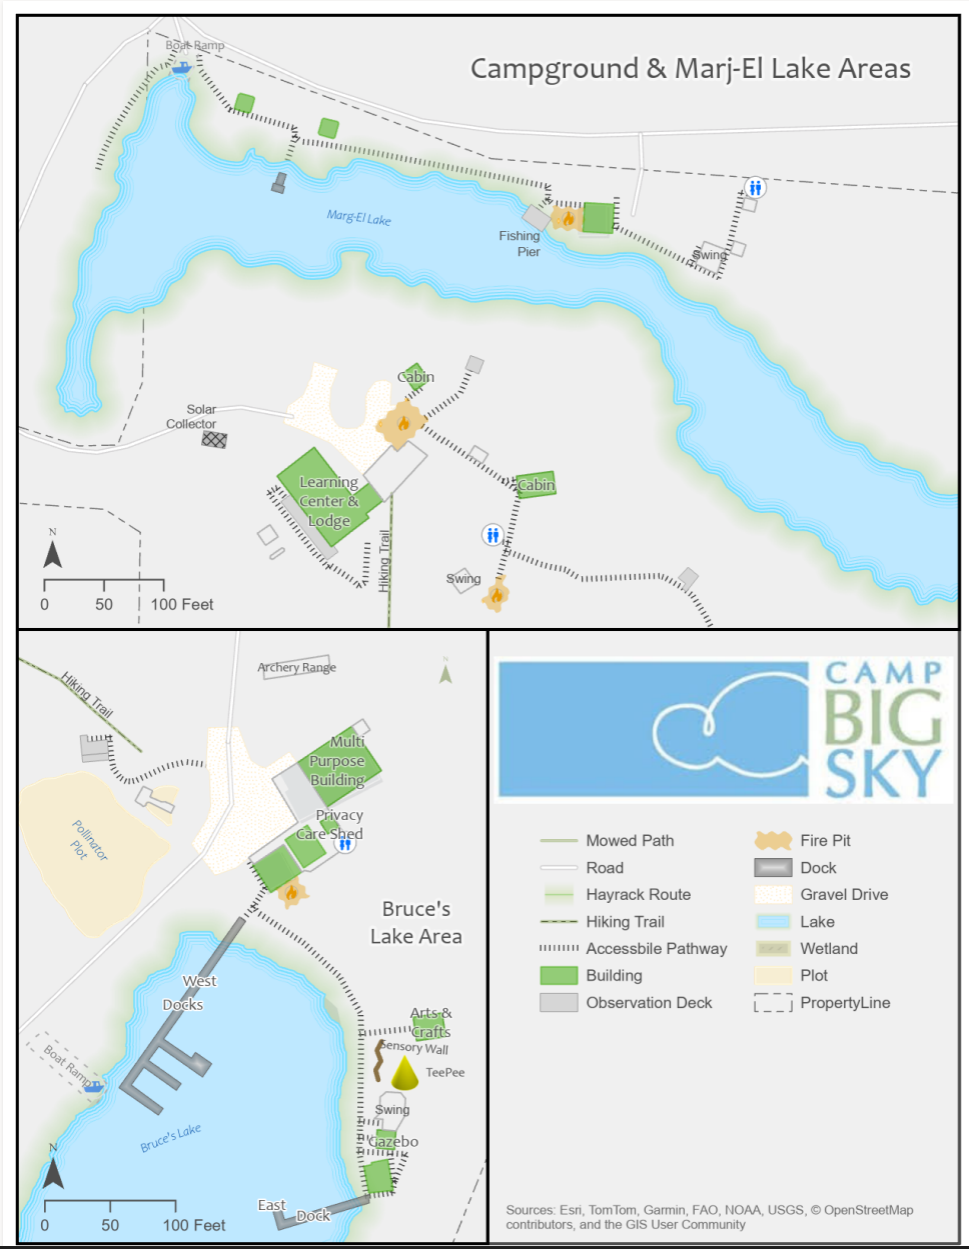
We provided the founder of Camp Big Sky, Brad Guidi, with a poster-sized printout of the aerial imagery. He identified the names of the features that had been digitized so that we could develop a GIS database that includes:
Natural features like lakes, trails, and tree cover.
Infrastructure elements such as buildings, parking areas, and accessibility features.
Points of interest that allow visitors and staff to both enjoy and navigate the camp more easily.
Mapping paper products like a wall map with great imagery or a 8.5 X 11 photocopy to hand out to visitors.
The Impact
These maps will help visitors, volunteers, and staff make the most of Camp Big Sky’s outdoor experiences. The GIS solution will also enable the organization to manage their property more efficiently and plan for future improvements. We have their GIS saved securely for continued updates or applications they may need.
By expanding beyond the original request for “a map,” we’re providing Camp Big Sky with tools that will help them enhance visitor experiences and support future growth and funding opportunities.
This project showcases how GIS technology can support nonprofits in meaningful ways, and we’re proud to contribute to Camp Big Sky’s mission.
To learn more about Camp Big Sky, visit their website at: https://campbigsky.org
If you have more question about how we can help you or your Organization with GIS, Contact us!

GIS for PLS at IPLSA in SPI
Earlier this month at the 2025 Illinois Professional Land Surveyors Association (IPLSA) conference, I had the opportunity to present What is GIS? in Springfield, Illinois. The session aimed at breaking down the fundamentals of Geographic Information Systems (GIS) and showing just how much this technology does beyond simply making maps. My goal was to help attendees understand the real power of GIS in infrastructure planning, data management, and decision-making across industries.
Geospatial > The Layer File > GIS for PLS at IPLSA in SPI
Exploring GIS at IPLSA 2025: A Look into the Future of Geospatial Technology
We covered the basic functions of GIS
Earlier this month at the 2025 Illinois Professional Land Surveyors Association (IPLSA) conference, I had the opportunity to present What is GIS? in Springfield, Illinois. The session aimed at breaking down the fundamentals of Geographic Information Systems (GIS) and showing just how much this technology does beyond simply making maps. My goal was to help attendees understand the real power of GIS in infrastructure planning, data management, and decision-making across industries.
To start, I walked through the basics of GIS—how spatial data is collected, stored, analyzed, and visualized. We covered coordinate systems, geodatabases, and why data accuracy is crucial in GIS workflows. This foundation set the stage for diving into real-world applications, where GIS helps land surveyors, civil engineers, transportation planners, and public works professionals work more efficiently.
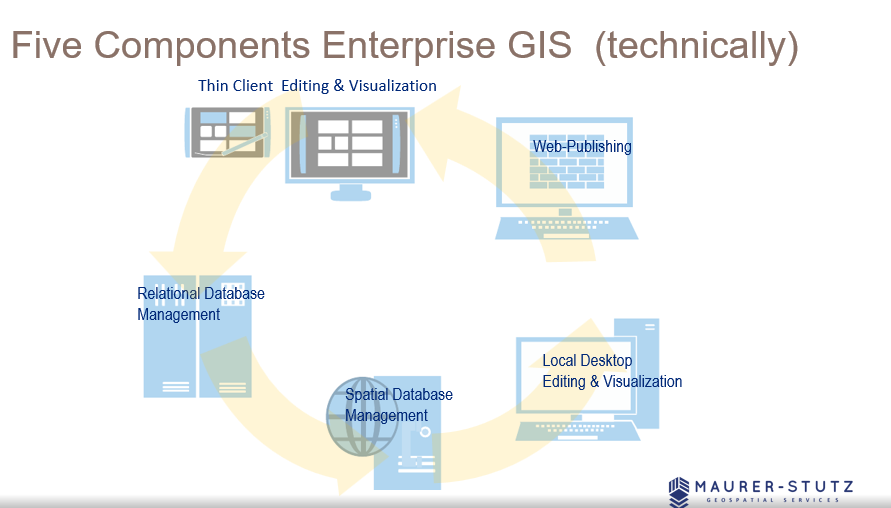
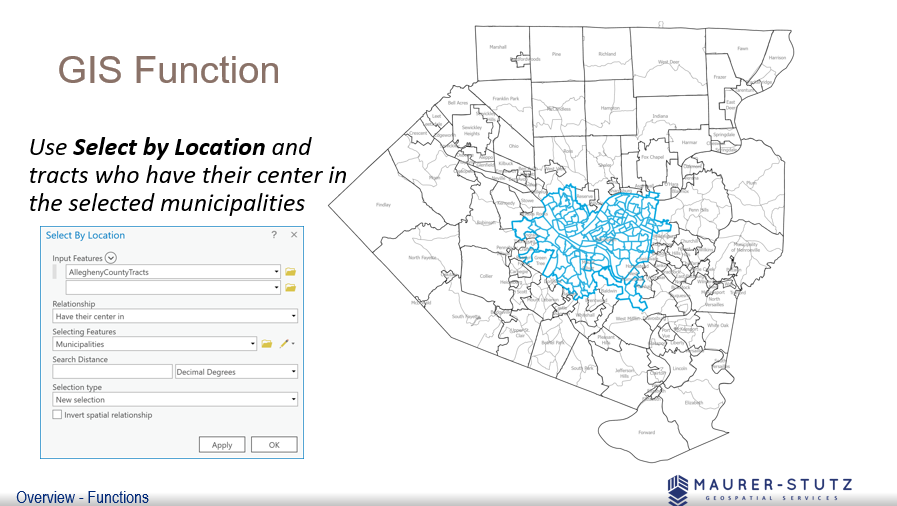
There are 5 components to make GIS an ‘enterprise GIS’
One of the most exciting parts of the presentation was showing off how GIS is used in municipal projects, transportation networks, and utility management to improve efficiency and accuracy. It was great to see the room engage with examples of how GIS lets us visualize changes over time, analyze trends, and make better decisions—whether it's tracking road conditions, mapping flood zones, or planning infrastructure upgrades.
We also talked about Enterprise GIS solutions and cloud-based GIS platforms, explaining how organizations use geospatial databases to streamline their operations. Cloud-based systems like ArcGIS Enterprise are game-changers, keeping data accessible and up-to-date for teams across departments.
Looking ahead, I touched on some exciting innovations in GIS, including Artificial Intelligence (AI) and machine learning in spatial analysis, real-time data integration with IoT sensors, and participatory GIS for public engagement. It’s incredible how GIS is evolving to include more automation and real-time data, making it even more valuable for decision-making.
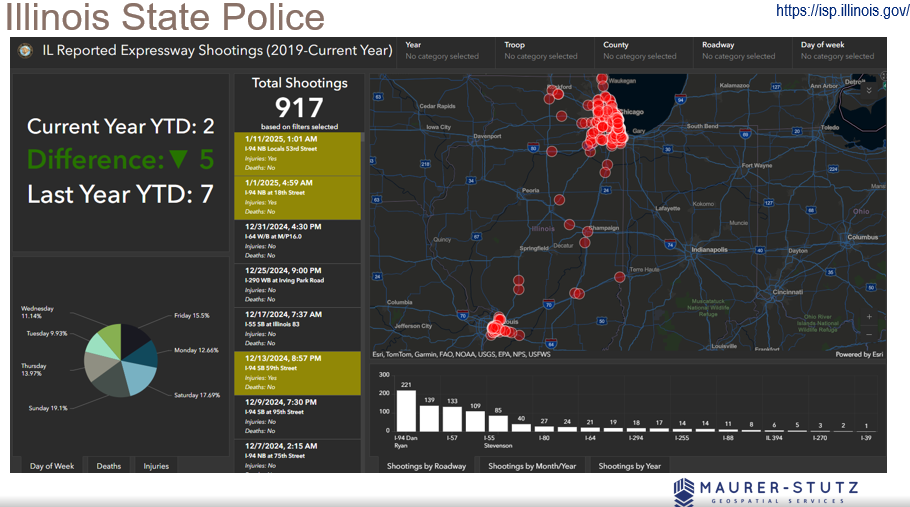
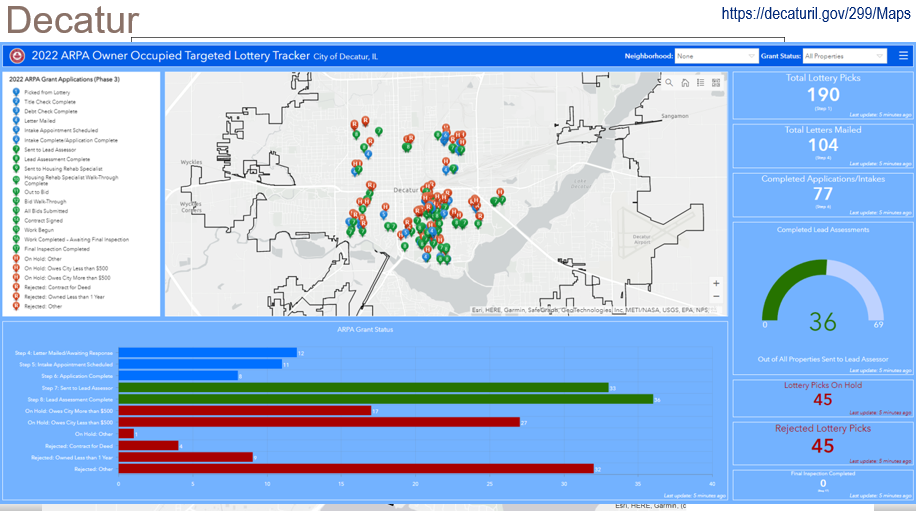
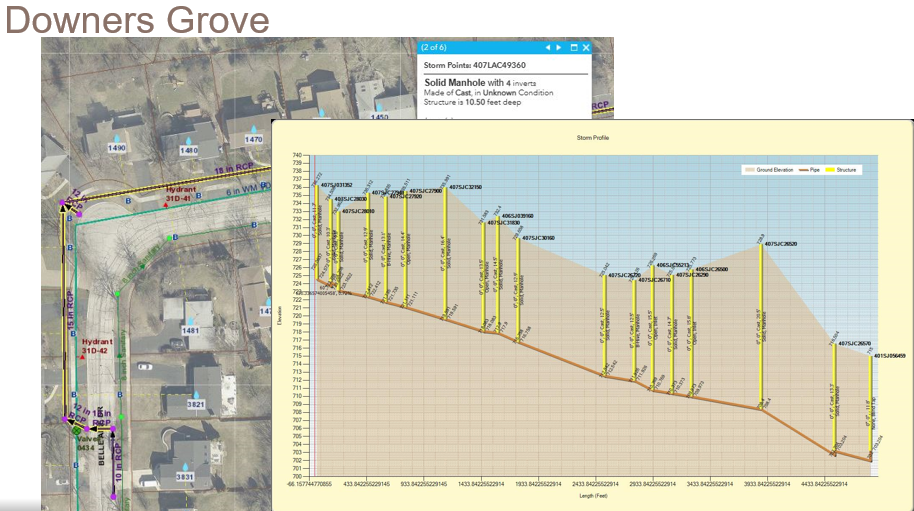
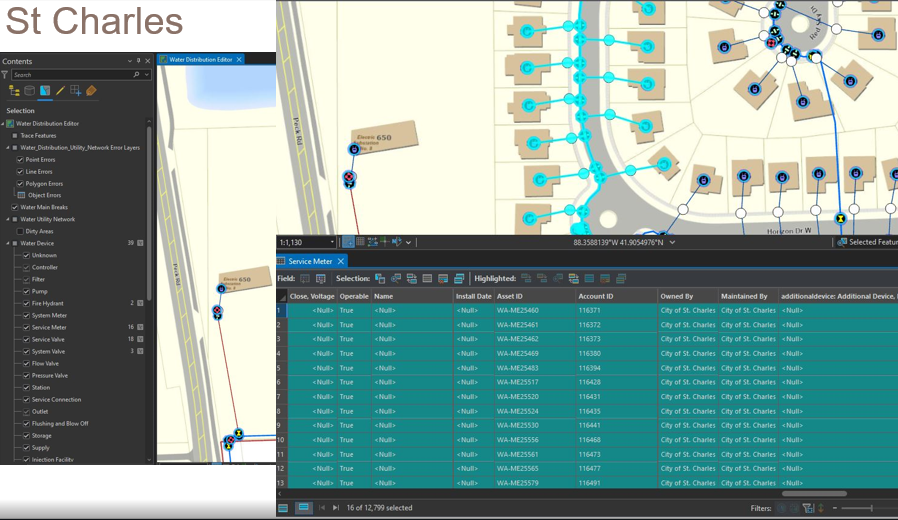
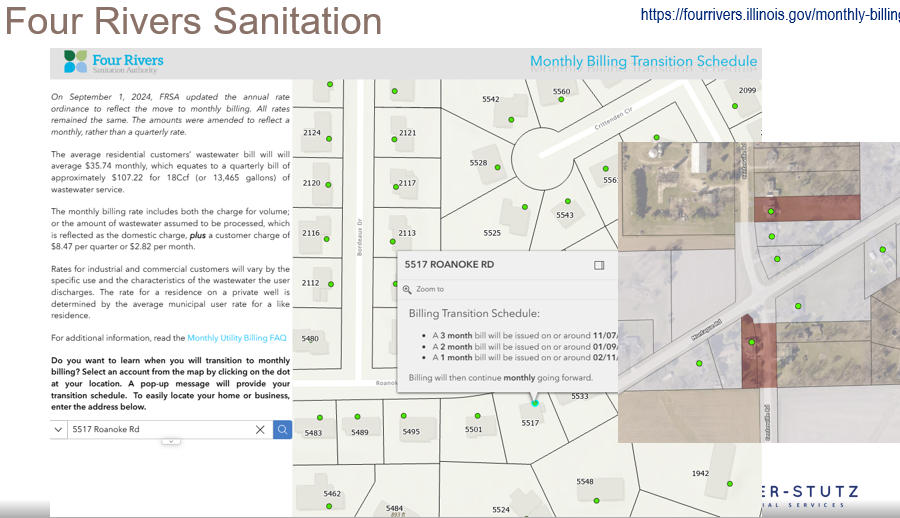
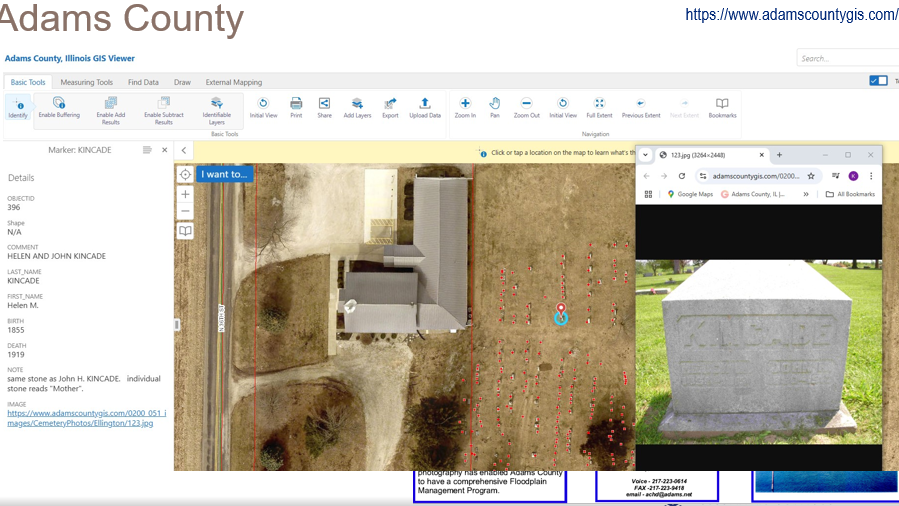
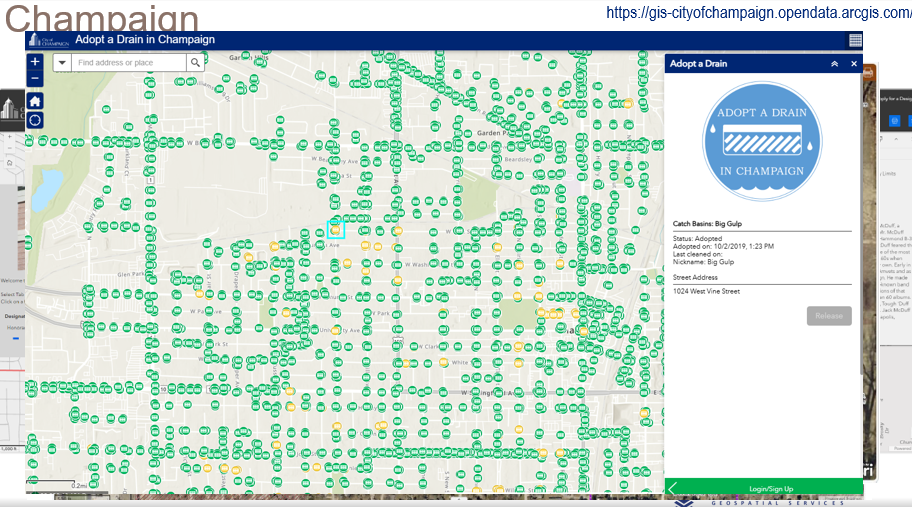
I had some great help from ILGISA friends around the state. I spent most of the time looking at these examples.
The key takeaway from the presentation is that GIS offers a vast range of possibilities, but it also requires a deep understanding of its technical complexities. By appreciating the skill and expertise involved, professionals can develop greater respect for GIS specialists and recognize the value they bring. Ultimately, fostering collaboration rather than opposition will lead to more effective and innovative solutions in the industry.
GIS is constantly evolving, and its impact reaches far beyond mapping—it’s about making smarter, data-driven decisions that shape our communities. Presenting at IPLSA 2025 was a great opportunity to share that message and connect with others who are just as passionate about geospatial technology as I am. The presentation is Here.