
Move it! Migrating A Survey123
Survey123 has been around for a while and is a powerful tool in the geospatial belt of tools. Whether you're moving projects between ArcGIS Online accounts or just refining your Survey123 presentation, this post walks you through how to:
Recreate a Survey123 form in a new ArcGIS Online account using an existing Excel XLSForm
Re-upload existing survey data into the new hosted feature layer
Use HTML formatting to make numeric scores visually stand out—with color and boldnes

Survey123 has been around for a while and is a powerful tool in the geospatial belt of tools. I created a Survey of Coffee Shops a wile ago and wanted to recreate that with some old data. Whether you're moving projects between ArcGIS Online accounts or just refining your Survey123 presentation, this post walks you through how to:
Recreate a Survey123 form in a new ArcGIS Online account using an existing Excel XLSForm
Re-upload existing survey data into the new hosted feature layer
Bonus of Using HTML formatting to make numeric scores visually stand out—with color and boldness
Step 1: Export from Your Old/Other ArcGIS Online Account
If your Survey123 form was created using Survey123 Connect, you probably already have:
A feature class (downloaded or exported from AGOL)
The original Excel spreadsheet (your XLSForm) used to build the survey
if not, You can ‘Open in Survey123 Connect’ from the AGO interface and then save the XLSX locally. For the Layer from AGO, export the feature layer data as a File Geodatabase, shapefile, or simply use ArcGIS Pro to copy the features. (More on this process below)
Step 2: Recreate the Survey in Survey123 Connect
Open Survey123 Connect and log in with your target ArcGIS Online account.
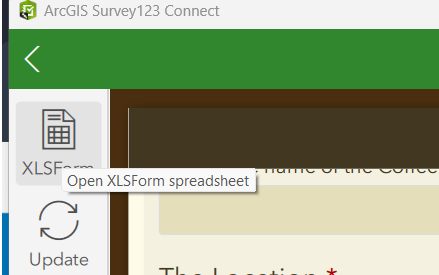
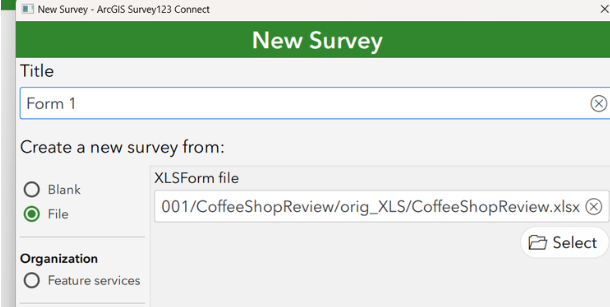
Click "New Survey"
Select the “File” tab, then choose your original Excel XLSForm
Name the survey appropriately because you this name attached it self to a lot of items, and click Create.
This step builds a new feature layer and form structure based on your original XLSForm.
Step 3: Publish the Survey
Once your survey form looks correct:
Click “Publish” to push the survey and create a new hosted feature layer in your new account
Step 4: Migrate the Old Data
Use ArcGIS Pro to migrate the feature class data into the new Published hosted feature layer:
Open a new project and sign in with your target AGO account
Add your original feature class (from download/export)
Add your new empty hosted feature layer (created when you published the survey)
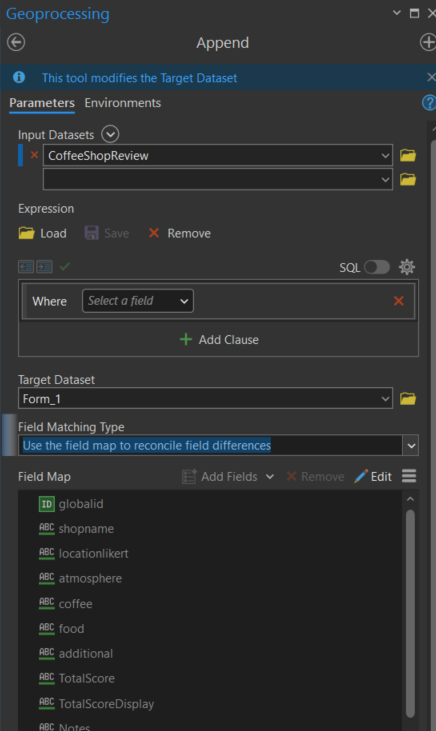
Use the “Append” tool to transfer records with attachments (or Copy/Paste if no attachments)
Make sure field names, types, and domains match—adjust schema if needed. I always map the field on an append.
Bonus! Step 5: Add Formatted Score Output with HTML
You can use HTML tags inside a note question in Survey123 to style the output of a calculated score.
For example, to make the TotalScore field change color based on value, and appear bold, use this formula in the calculation column of a note question:
if($ >= 20,
   concat('<font color="green" size="5"><b>', $, '</b></font>'),
   if($ >= 15 and $ < 20,
      concat('<font color="blue" size="5"><b>', $, '</b></font>'),
      if($ < 15,
         concat('<font color="red" size="5"><b>', $, '</b></font>'),
         ''
      )
   )
)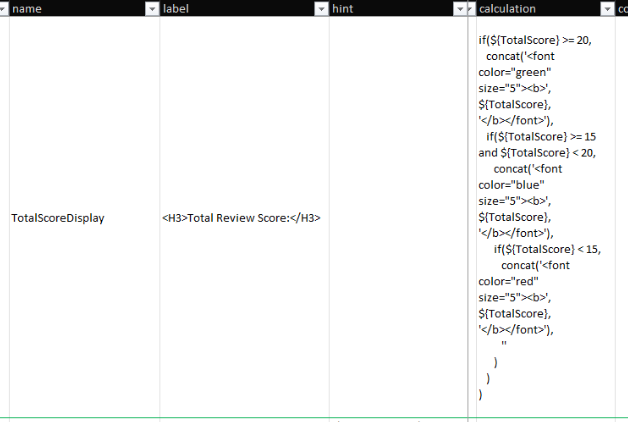
Point of note: For some reason this doesn’t display in the Survey123Connect accurately in the preview, but it works after publishing
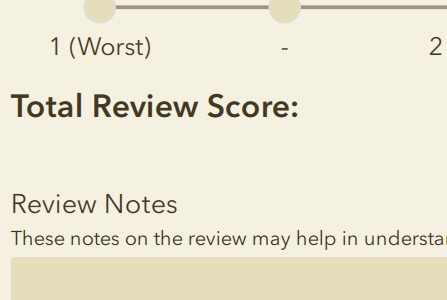
Survey123 Connect Preview
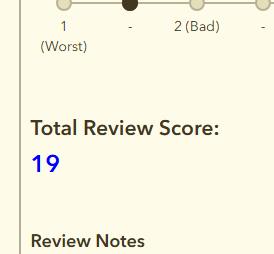
Opened in Browser looks fine and formatting works!
This workflow lets you fully migrate a Survey123 form and its data between accounts and enhance the user experience by formatting key values. Using just a few lines of HTML and Survey123 logic, you can make your forms more engaging, readable, and responsive. If you have any coffee shops you want to review drop them here.
Send us and email if you have any questions

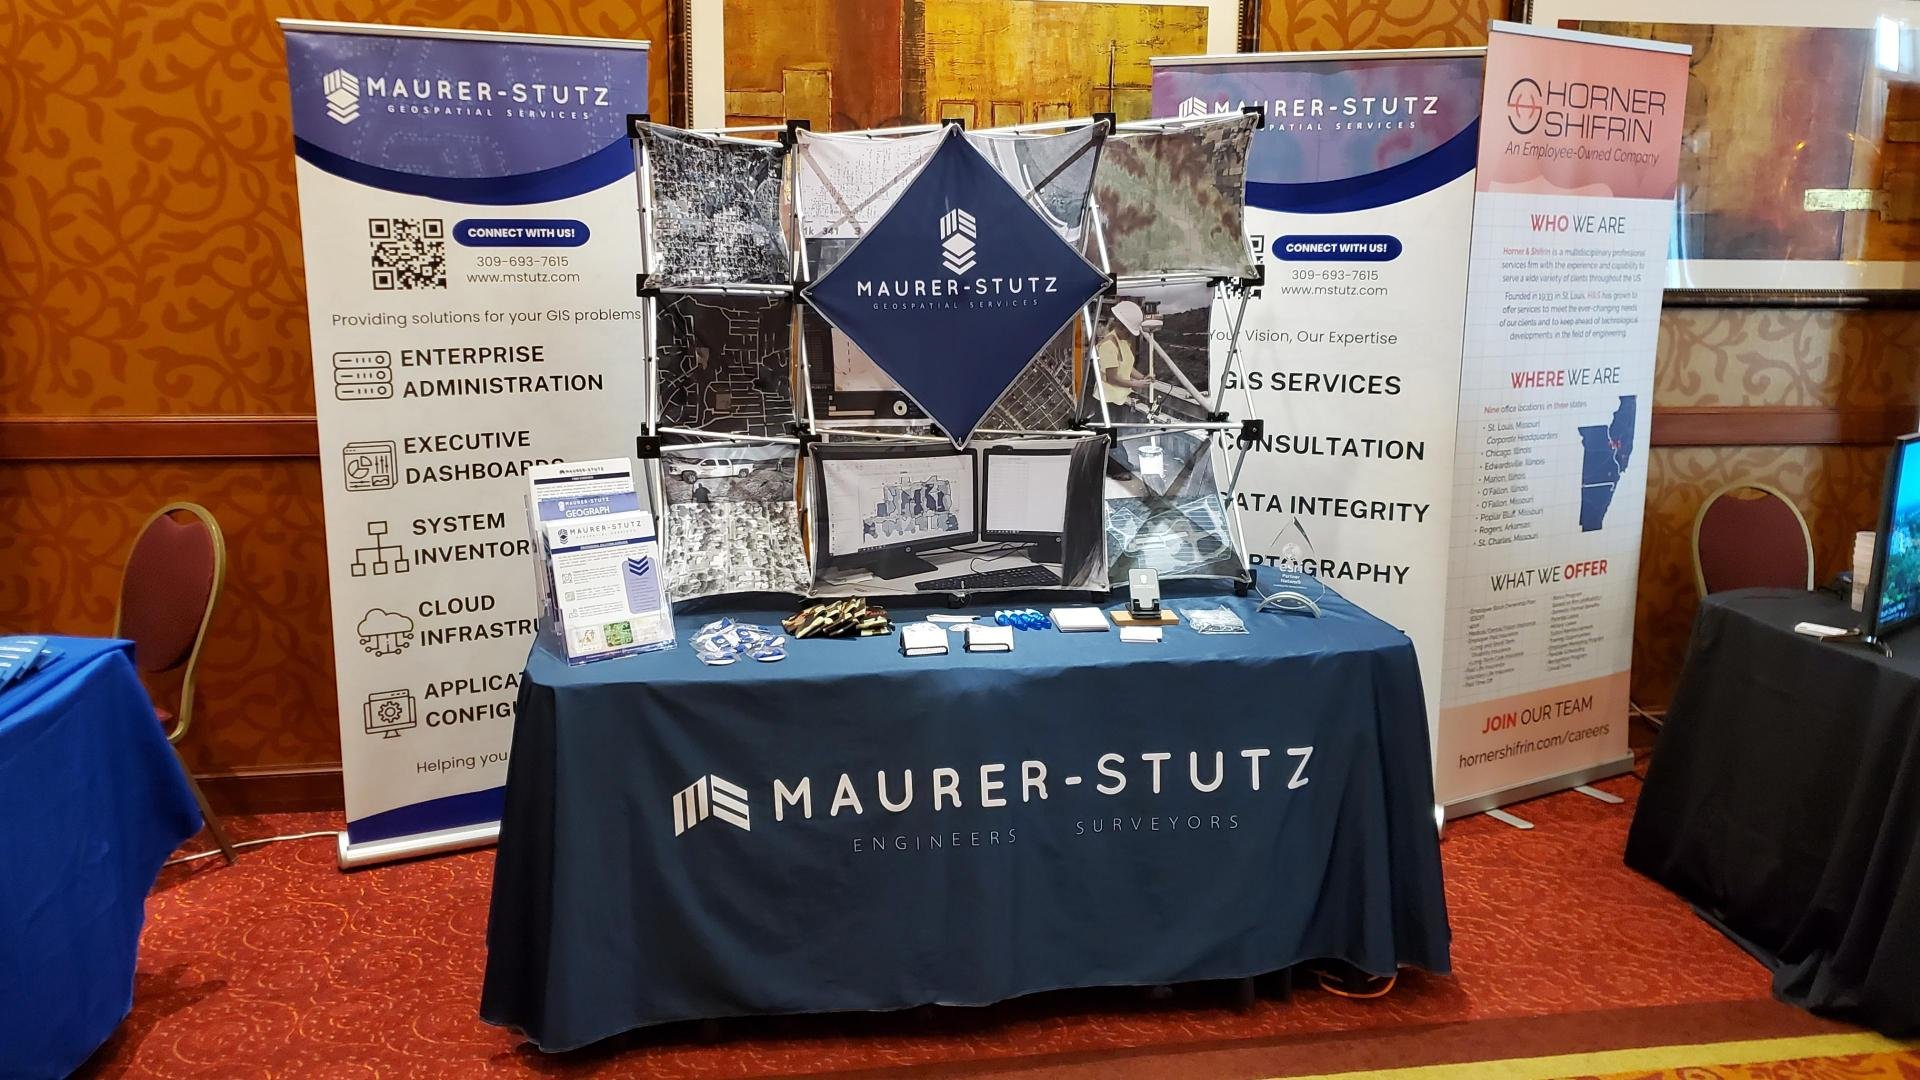
Rolling for Initiative at the ITAG Conference
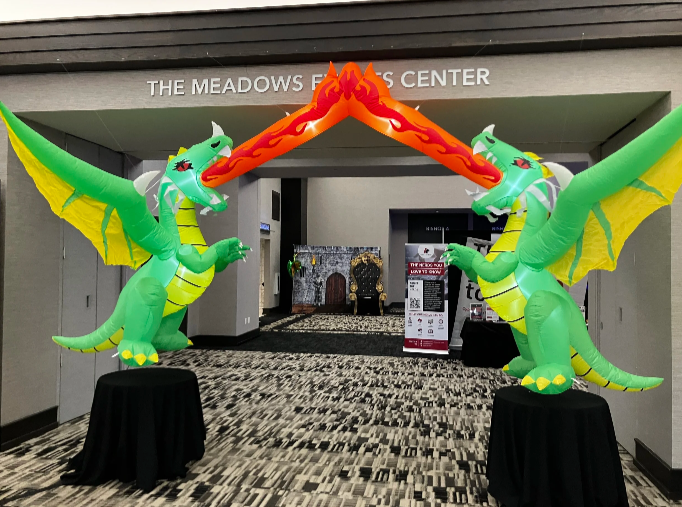
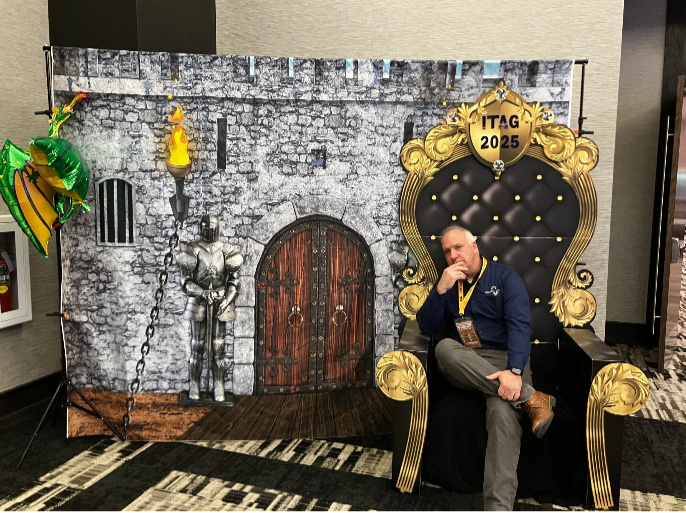
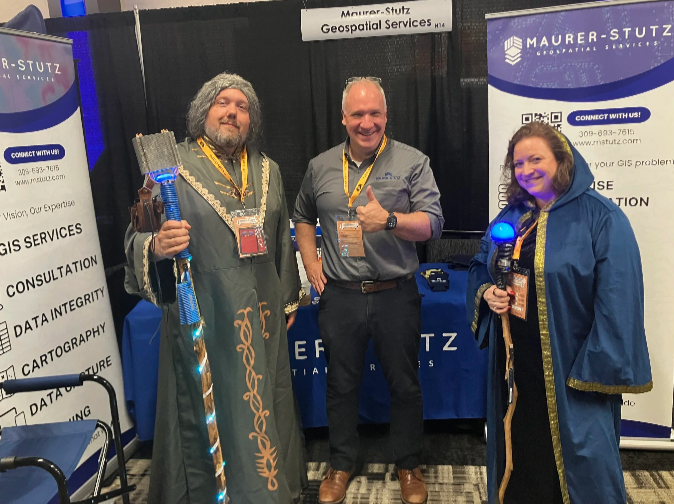
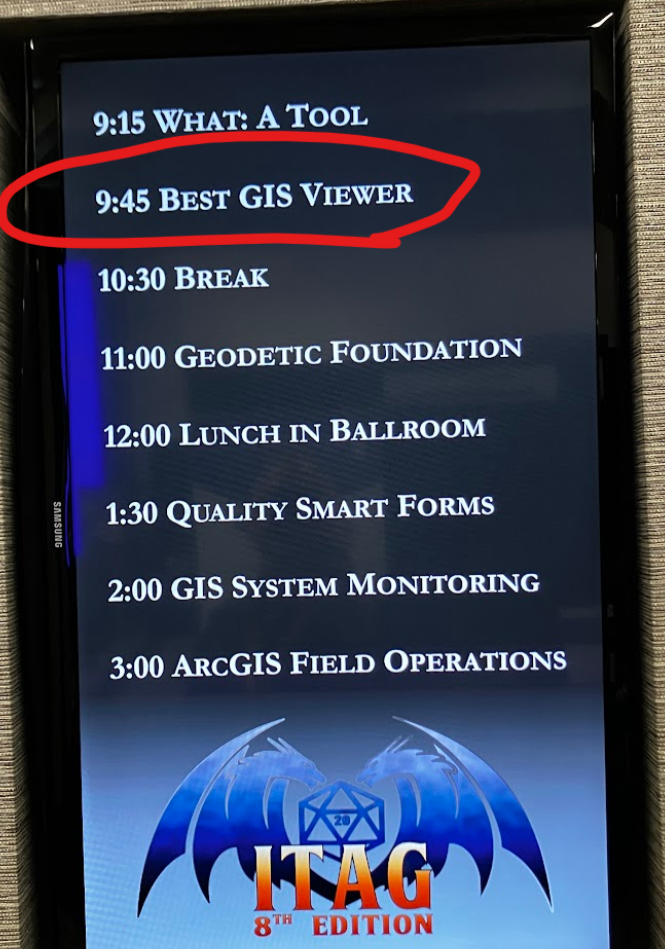
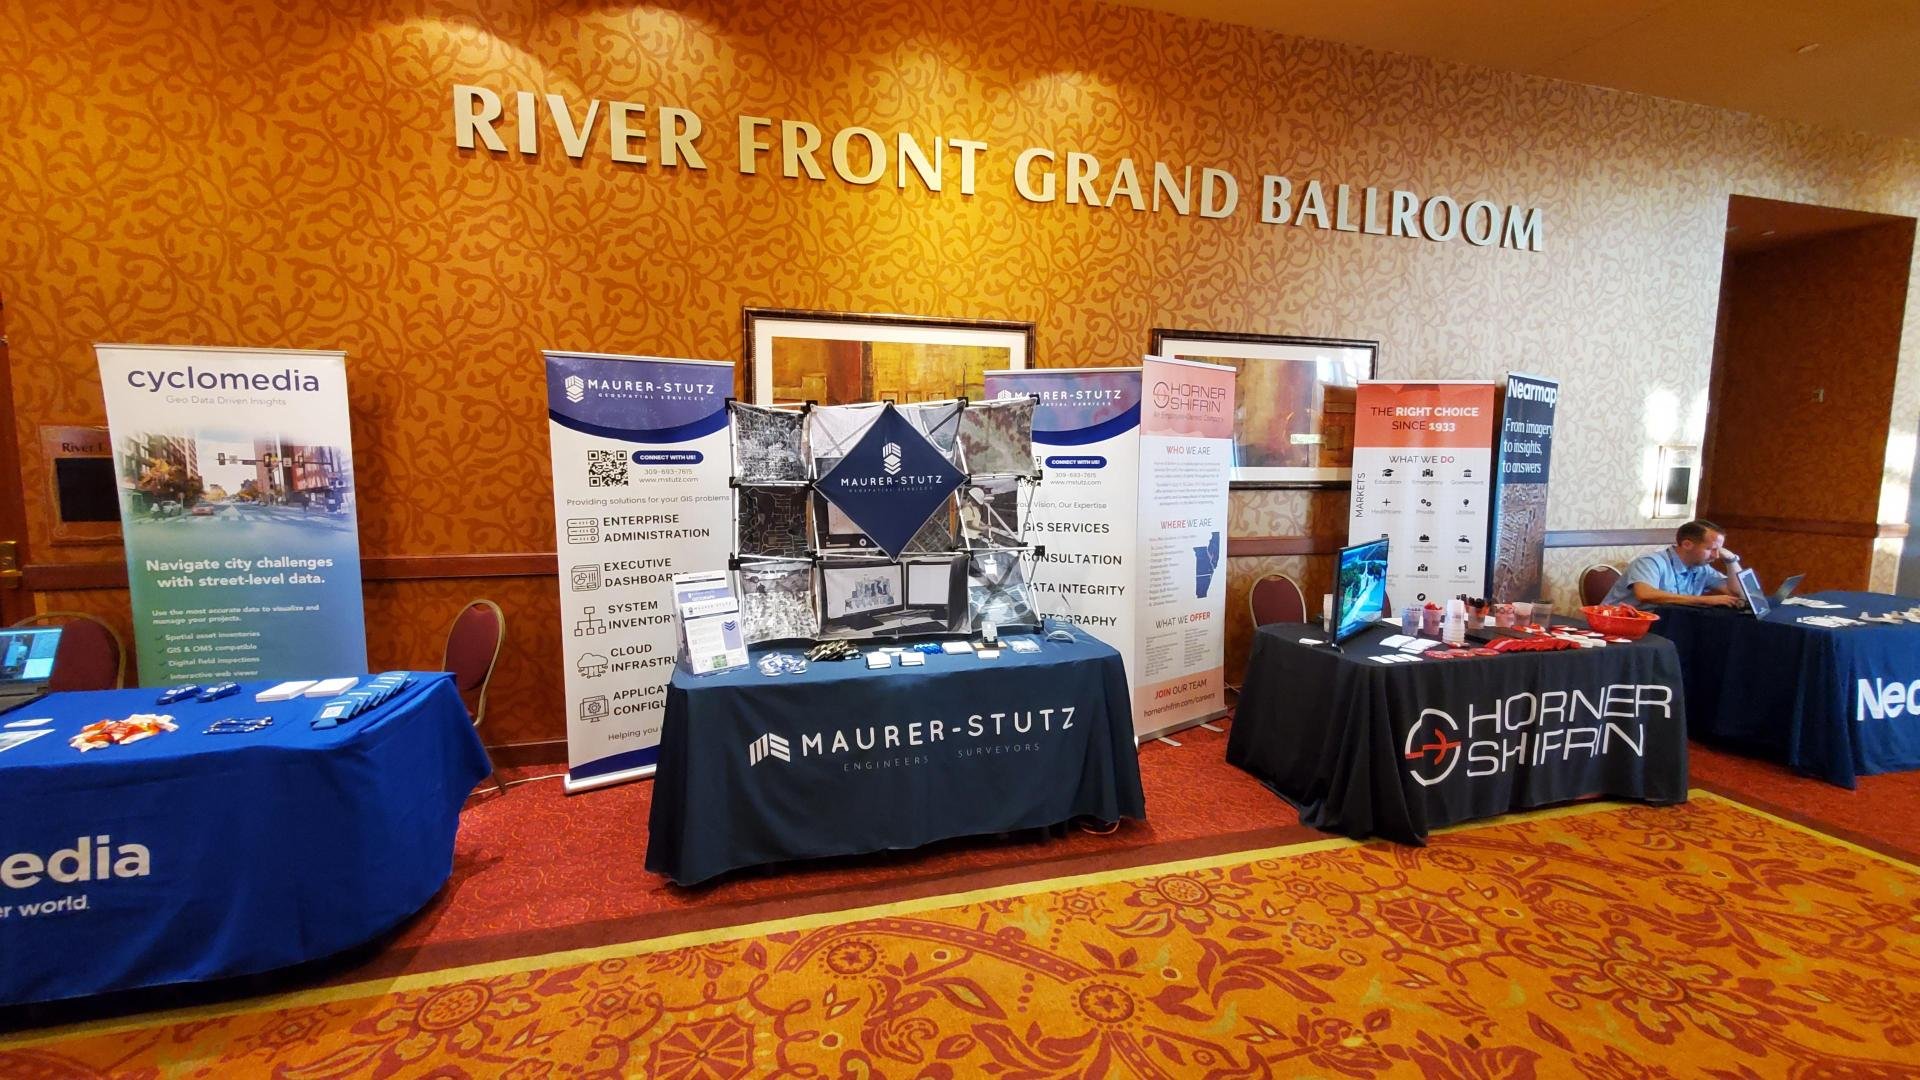
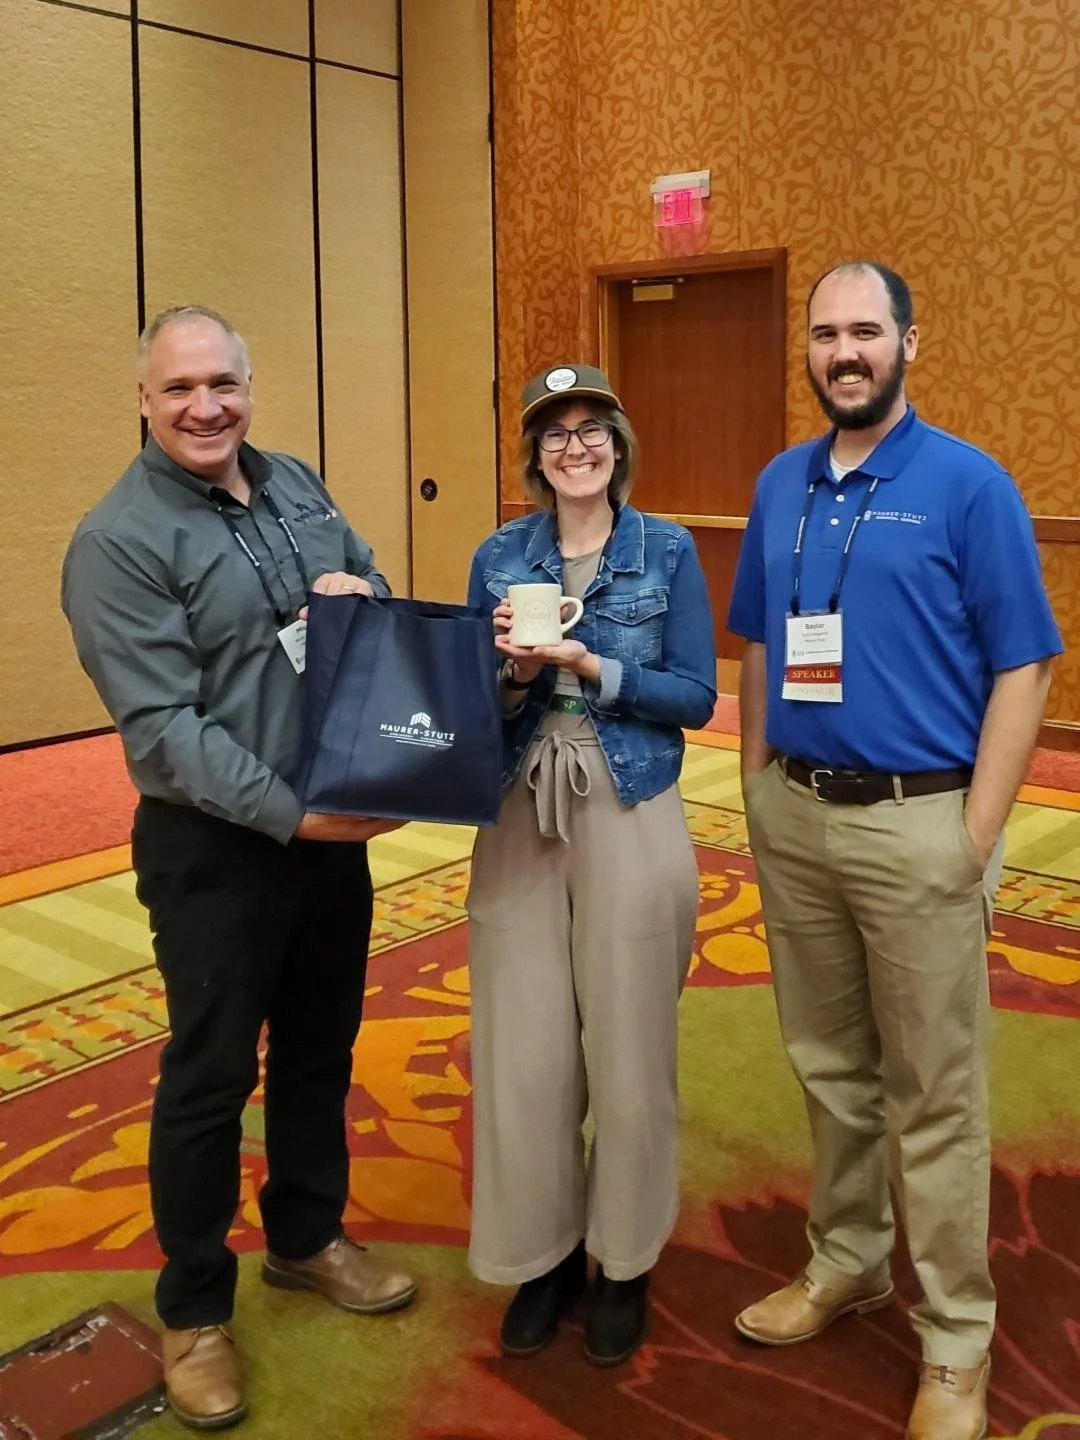
I recently had the incredible opportunity to attend the ITAG Conference from June 3-5, 2025, at The Meadows Events and Conference Center in Altoona, IA. As a first-timer, I was half-expecting the typical tech conference, but the whole Dungeons & Dragons theme was a brilliant touch – it really set the stage for an ‘epic adventure’ in learning and networking, right from the entryway.
I recently had the incredible opportunity to attend the ITAG Conference from June 3-5, 2025, at The Meadows Events and Conference Center in Altoona, IA. As a first-timer, I was half-expecting the typical tech conference, but the whole Dungeons & Dragons theme was a brilliant touch – it really set the stage for an ‘epic adventure’ in learning and networking, right from the entryway.
For those unfamiliar with this quest, the ITAG Conference is a collaborative annual event brought to us by the Iowa Geographic Information Council (IGIC) and the Iowa Counties Information Technology (ICIT) organizations. It's awesome how they combine their individual conferences into one big, comprehensive technology and geospatial event. They really understand the overlap between IT and GIS and celebrate with nerd within.
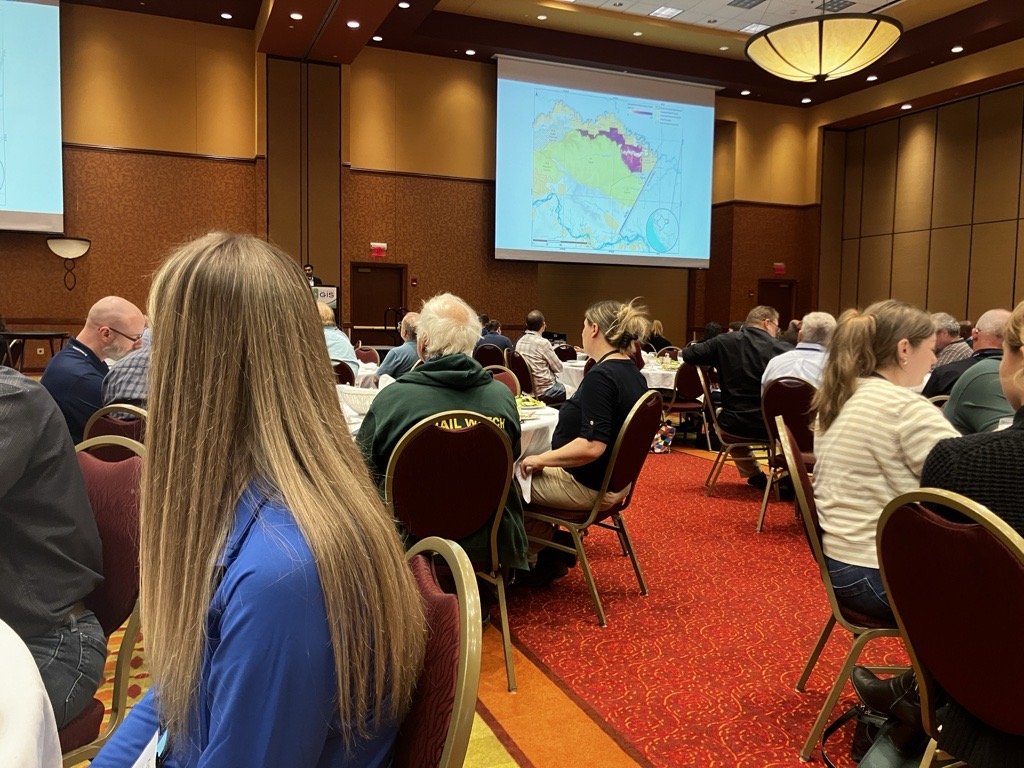
I was there as both an exhibitor and a presenter, which gave me a unique and engaging perspective on the entire event. The conference was packed with valuable insights, offering over 50 hours of diverse educational content. The main conference, spanning from Wednesday, June 4, through Friday, June 6, was thoughtfully structured with five distinct educational tracks. Two of these tracks were specifically dedicated to geospatial technologies, while another two delved deep into essential IT technologies. The fifth track provided a more general focus, ensuring there was something for everyone. This variety allowed attendees to really tailor their experience and dive into the topics most relevant to their skills, strength and charisma.

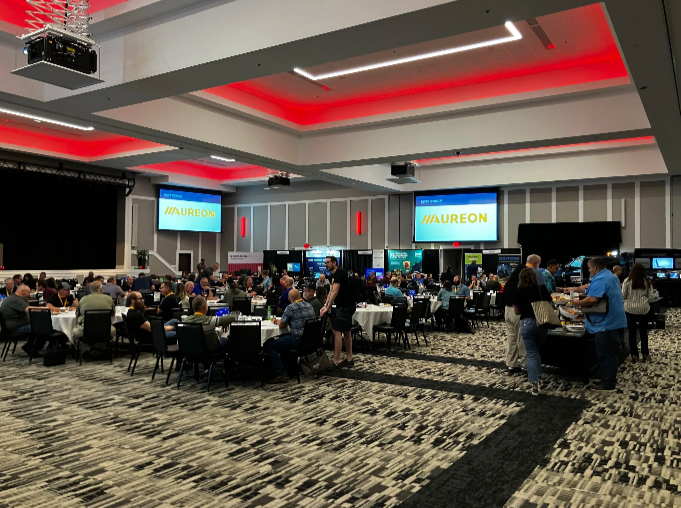

Beyond the structured learning, the emphasis on networking and the exchange of knowledge and professional practices truly shone through. I loved having the chance to connect with so many talented professionals from various fields, sharing ideas, and hearing about different approaches and best practices. It's clear that the primary goal of the conference is to promote education, training, and cooperation in both technology and GIS, and they certainly achieved that, even rolling a 20! (OK, last lame joke)
The conference fostered a very welcoming environment, and it was great to see that attendance wasn't restricted by IGIC or ICIT membership, as I have neither. This inclusivity really broadens the scope of discussions and makes for a richer experience for everyone involved. Plus, the well-organized opportunities for professional networking, combined with pleasant meals and entertainment, added to the overall positive atmosphere, making the entire experience even more enjoyable and memorable.
Whether you're deeply immersed in GIS, passionate about IT, or simply curious about the latest advancements and collaborations in technology, this conference is definitely for you. I gained so much, both in terms of knowledge and valuable connections, and I wholeheartedly recommend it to anyone in the field and can’t wait to see the theme for next year.
I had such a positive experience and learned an immense amount. I'm already looking forward to next year and can't wait to see what new insights and connections the next ITAG Conference brings!
Reports, Reporting for Duty
At Maurer-Stutz Geospatial Services, we have many projects that require reporting. Today, we want to help other ArcGIS Pro users utilize the reporting functions built within that system in an easy and effective way.
Utilizing ArcGIS Reports
At Maurer-Stutz Geospatial Services, we have many projects that require reporting. Today, we want to help other ArcGIS Pro users utilize the reporting functions built within that system in an easy and effective way.
The Reports function allows you to quickly generate a report from your data. You can:
Display only the fields you specify for each feature.
Add visual elements like graphs and charts.
Filter the data to show only what’s relevant to the purpose of the report.
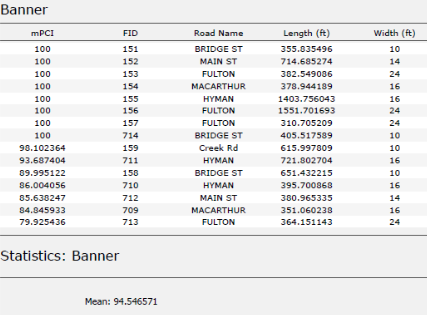
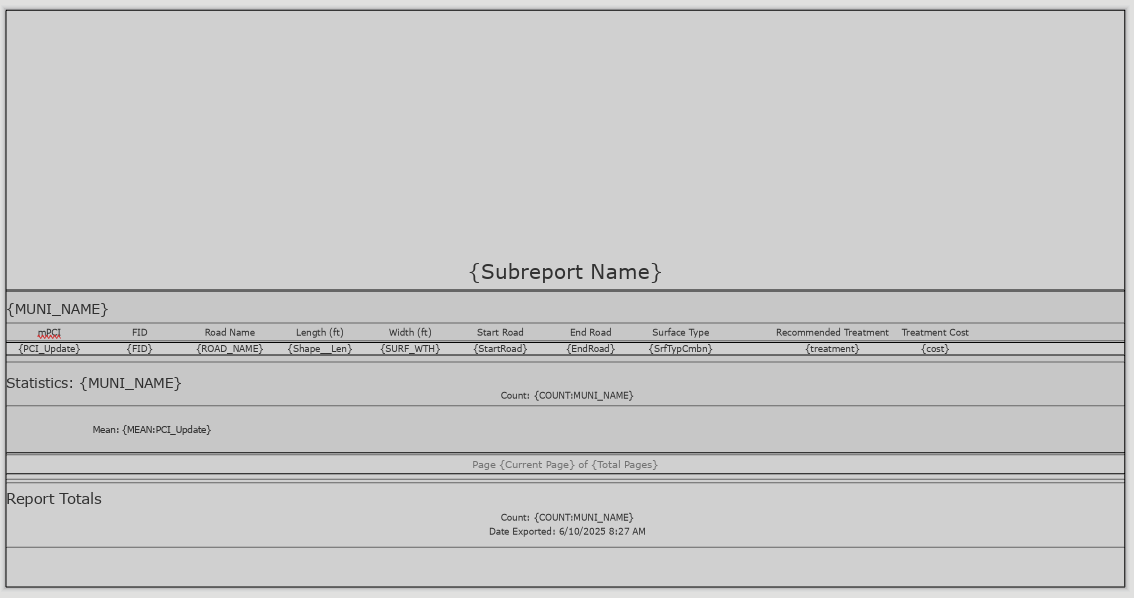
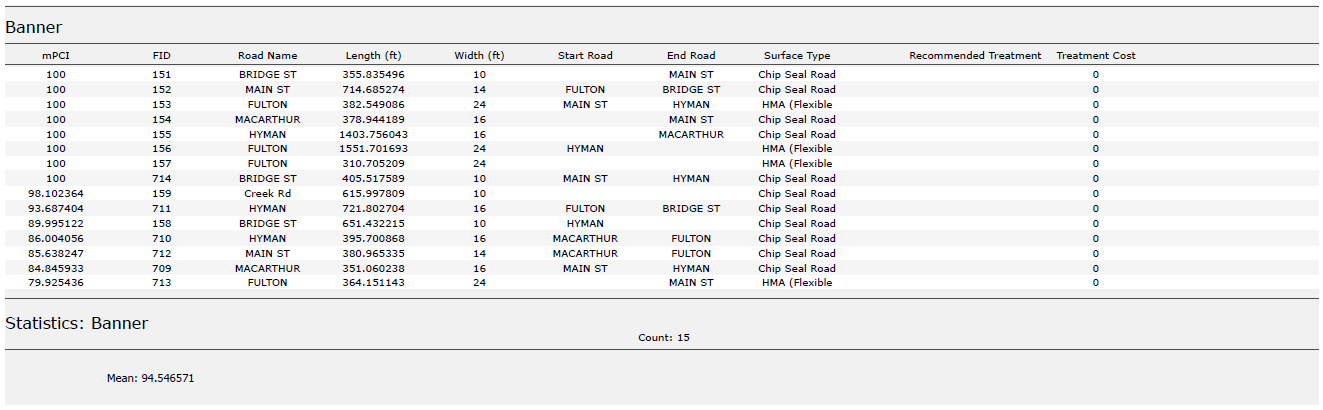
In this example, I used road assessment data as my source, and wanted to create a report showing me each road across 11 different towns, sorted from worst to best based on their score (mPCI).
Step 1: Select Your Data
Select the map frame that contains the data you want to use.
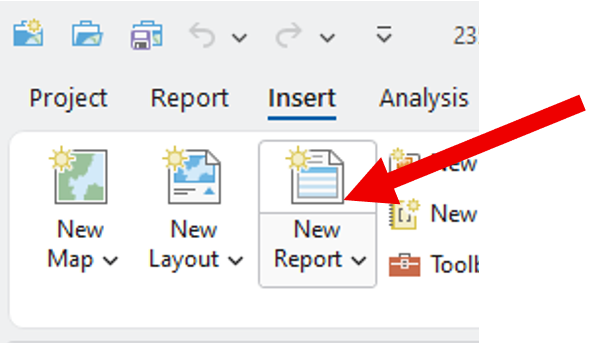
Go to the Insert tab and click New Report.
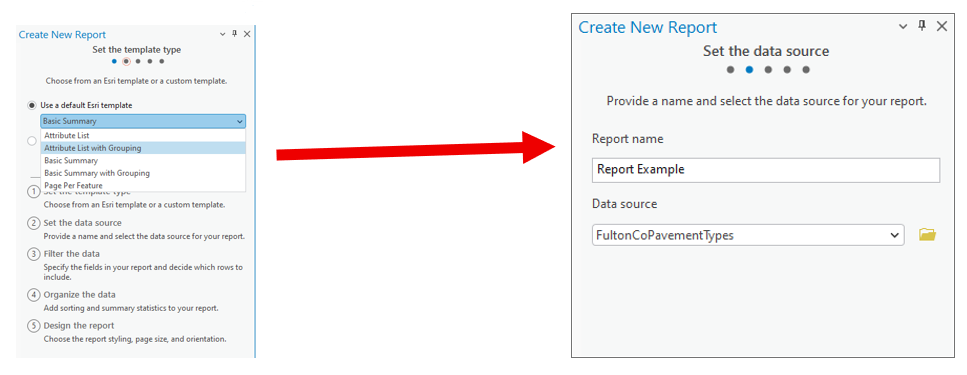
Step 2: Choose a Template
Select a report template.
Example: Choose Attribute List with Grouping.Name your report.
Select the data source (the dataset you’ll report on).
Step 3: Organize the Data
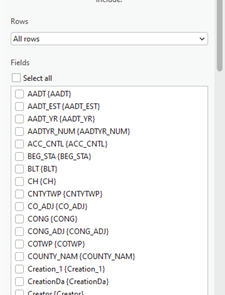
Choose the fields you want to display.
Example: For a road assessment, include:Road Name
Assessment Score
Length
Width
Material
Other relevant details
Tip: Drag and drop fields to reorder them in the report.
2. Select a grouping field to organize your report.
Example: Group by Municipality.
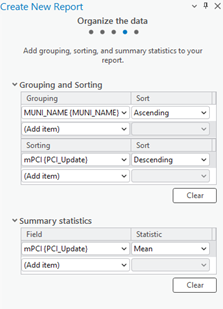
3. Define sorting rules within each group.
Example: Sort roads by Assessment Score (descending),
so the lowest scores appear first.
4. (Optional) Add group statistics:
Choose a field (e.g., Assessment Score).
Select a statistic (e.g., Mean) to summarize each group.
5. Set your page size and click Finish.
Step 4: Preview the Report
Your report will now display:
Each road grouped by municipality.
Roads within each group sorted by assessment score.
You can rename column headers to make them more readable.
(Just like editing text in Layout View.)
Step 5: Export the Report
Export the report as a PDF or another supported format.
Your final report will include:
Organized, grouped, and sorted data.
Optional charts, statistics, or summary sections if added.
Additional Tips
Use the Insert tab to:
Add more fields or statistics after the report has been created.
Insert charts, dynamic images, or text blocks.
Choose where these additions appear:
Statistics Group: Appears at the end of each group (e.g., each municipality).
Report Totals: Appears at the very end of the full report.
We hope this has been a casual guide to creating reports in ArcGIS. It walks you through generating a report from your data, showing you how to pick what information to display, add visuals like graphs and charts, and filter what's relevant. You'll learn how to select your data, choose a template, organize your information by grouping and sorting, preview your report, and finally, export it as a PDF or other format. There are also some neat tricks for customizing your report, like adding more fields or charts after it's been created
If you have other questions please don’t hesitate to contact us in the form below.

One Year With Engineers
A year ago, I walked into Maurer-Stutz with a mission: to build something new, something purpose-driven, something lasting. That something became Maurer-Stutz Geospatial Services (MSGS). Now, 12 months in, I can confidently say we’re not just building a team—we’re building momentum

One Year at Maurer-Stutz: Building a Geospatial Foundation for the Future
A year ago, I walked into Maurer-Stutz with a mission: to build something new, something purpose-driven, something lasting. That something became Maurer-Stutz Geospatial Services (MSGS). Now, 12 months in, I can confidently say we’re not just building a team—we’re building momentum.

Starting From the Ground Up
When I joined the company on April 29, 2024, the Geospatial Department was more of an idea than an entity. With one GIS Specialist; Katie Kopkowski, who stuck around to be the anchor, we had talent, but we needed direction, structure, and an identity. I knew from the beginning that MSGS couldn’t be “just the map guys” on engineering projects. MSI leadership wanted us be strategic partners, not just a service department. Trusted advisors, not only task-takers.
Beigin at the begining
So, we began with the essentials. Working through the process as if we were starting a new business, but with the advantage of having supporting oversight structure.
Conducted a full assessment of existing software, hardware, and workflows.
Evaluated team strengths and gaps in a SWOT analysis.
What engineering clients existed and which represented low-hanging fruit.
Built a business plan with a six-year growth strategy, aligning revenue goals with staffing targets and market segments.
Developed mission and vision statements to clarify who we are—and who we are not
Building the Right Team
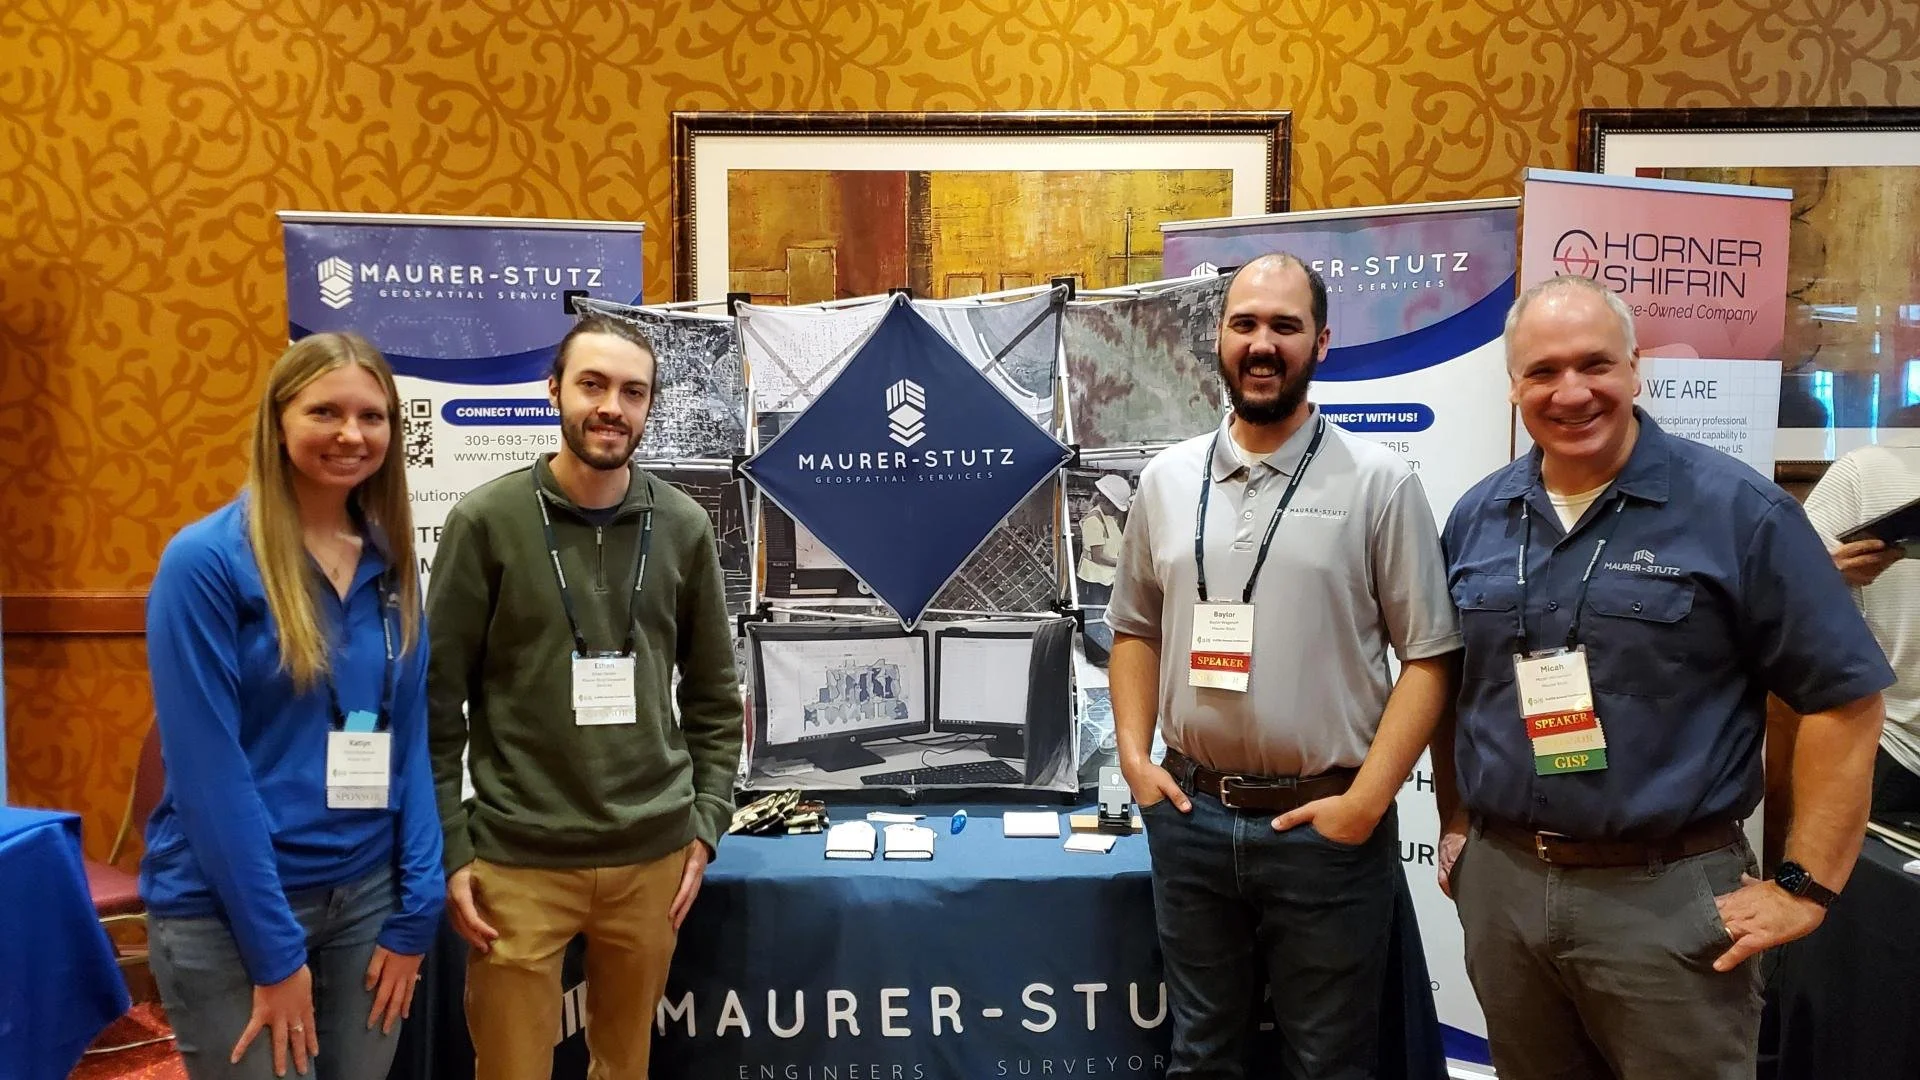
This work isn’t possible without people. I’m proud to lead a growing team that now includes Geospatial Engineer Baylor Wagehoft, fellow ISU Redbird Ethan Geisler, and Geospatial Intern Michelle Wagehoft. Next month, we will welcome our sixth employee who will focus on the Agricultural market. Each team member brings a unique set of strengths to the table and we’ve focused on creating a collaborative culture built on professionalism, mutual respect, and shared accountability with our Team Operations Manual (T.O.M.)

Growing with Purpose
In just one year, we’ve:
Supported multiple infrastructure and fiber deployments with precision GIS solutions.
Partnered with our own MSI engineering groups without becoming “support-only” on projects.
Initiated the modernization client GIS and database migration and tuning.
Established professional partnerships in cloud architecture, economic development, utilities, and broadband.
A key part of our journey has been thoughtfully drawing a line between the way things have traditionally operated at MSI and the direction we're heading—evolving from a service-oriented support group into a focused, independent, growth-focused team—a shift that will require continued clarity, communication, and collaboration as we grow. We’re becoming a revenue-generating, client-facing, innovation-focused business unit. And our identity is no longer in question—we are MSGS, and we are growing.
Looking Ahead

Up And To The Right!
Year one was about foundations. Year two is about scaling.
We’re focused on:
Expanding our managed services offerings.
Growing cloud GIS capabilities.
Deepening client relationships and building repeatable solutions.
Recruiting talent that shares our drive for innovation and excellence.
I’m grateful for the leadership at Maurer-Stutz inc. for supporting this vision, and for my team for embracing the challenge. This isn’t just about GIS—it’s about transformation. At MSGS, our mission is: To transform our clients' and industry partners' unique visions into reality through specialized geospatial expertise. Our B.H.A.G. is: By 2030, MSGS will be a recognized leader in geospatial services industry by providing solutions in the broadband, utility infrastructure, and consultant engineering domains.
Here’s to year two—and all the vision, trust, and growth it will bring.
We will accomplish this by delivering quality services with integrity, care, and efficiency. Working with you by design.
Email us for more information:
Mapping for a Cause
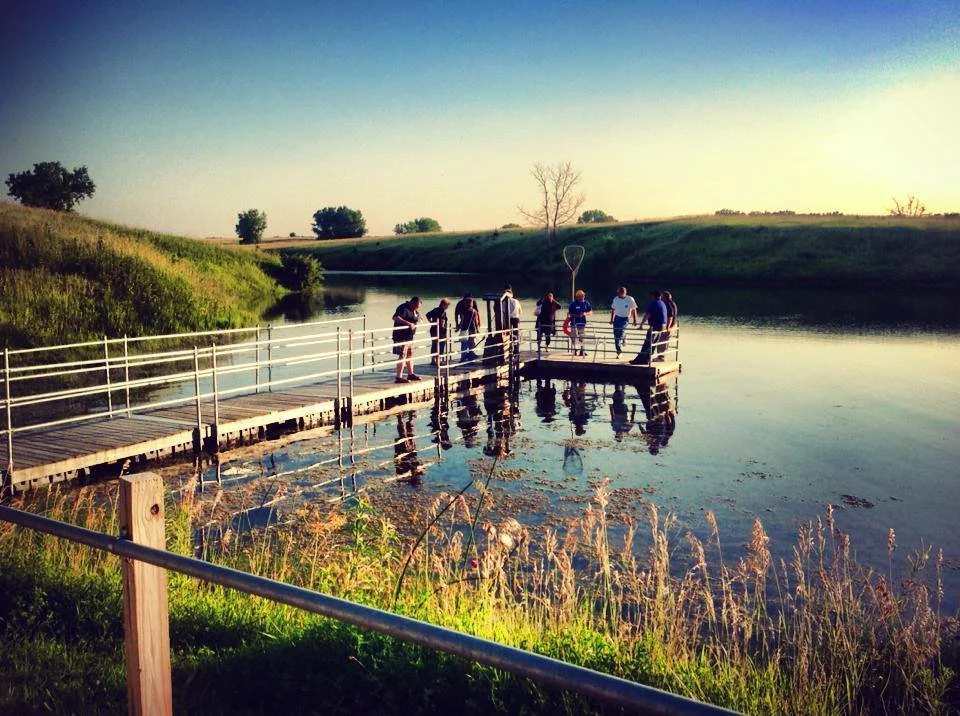
At Maurer-Stutz, Inc., we believe in using our expertise to give back to the community. One of our on-going relationships is with Camp Big Sky, a nonprofit in Fairview, IL, dedicated to providing outdoor experiences for individuals with disabilities.
Mapping for a Cause: Supporting Camp Big Sky with GIS
At Maurer-Stutz, Inc., we believe in using our expertise to give back to the community. One of our on-going relationships is with Camp Big Sky, a nonprofit in Fairview, IL, dedicated to providing outdoor experiences for individuals with disabilities.
“We’d Like a Map”
Camp Big Sky recently inquired about the possibility of having Mauer-Stutz Geospatial create a large display map to provide visitors with a clear overview of the camp - similar to maps found at theme parks or the beginning of a hiking trail. That request for a single map began a series of conversations.
Through our discussions with Camp Big Sky, a robust GIS solution developed allowing for the creation of a whole variety of customized maps. We discussed their need for duplicatable, day-use maps, maps specifically tailored for grant applications, online maps, etc.— all of which can easily be created from the GIS that was already being built!
How We’re Helping
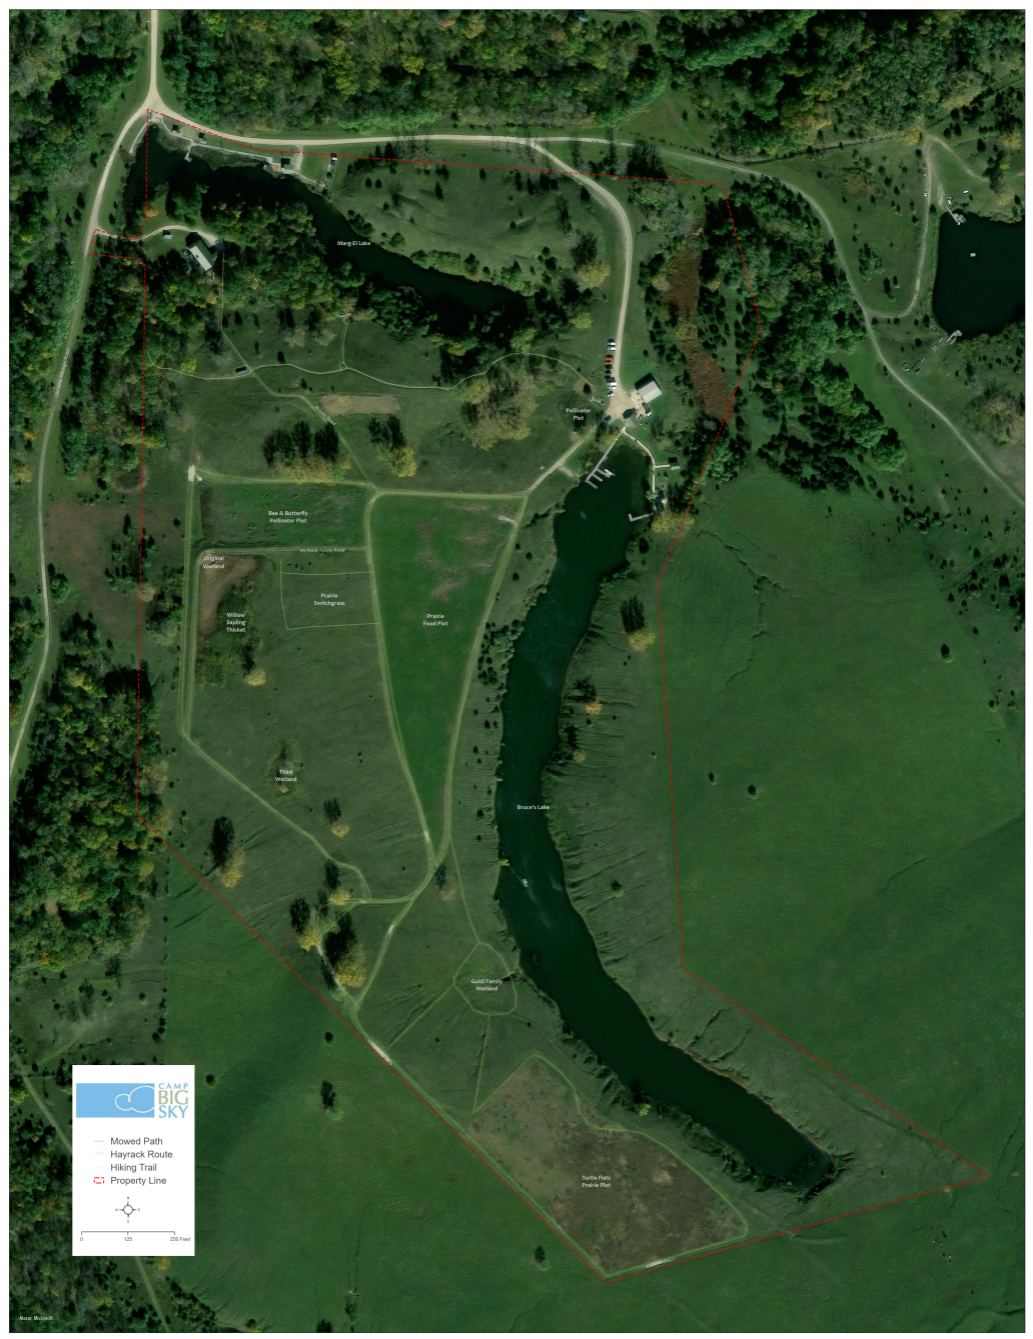
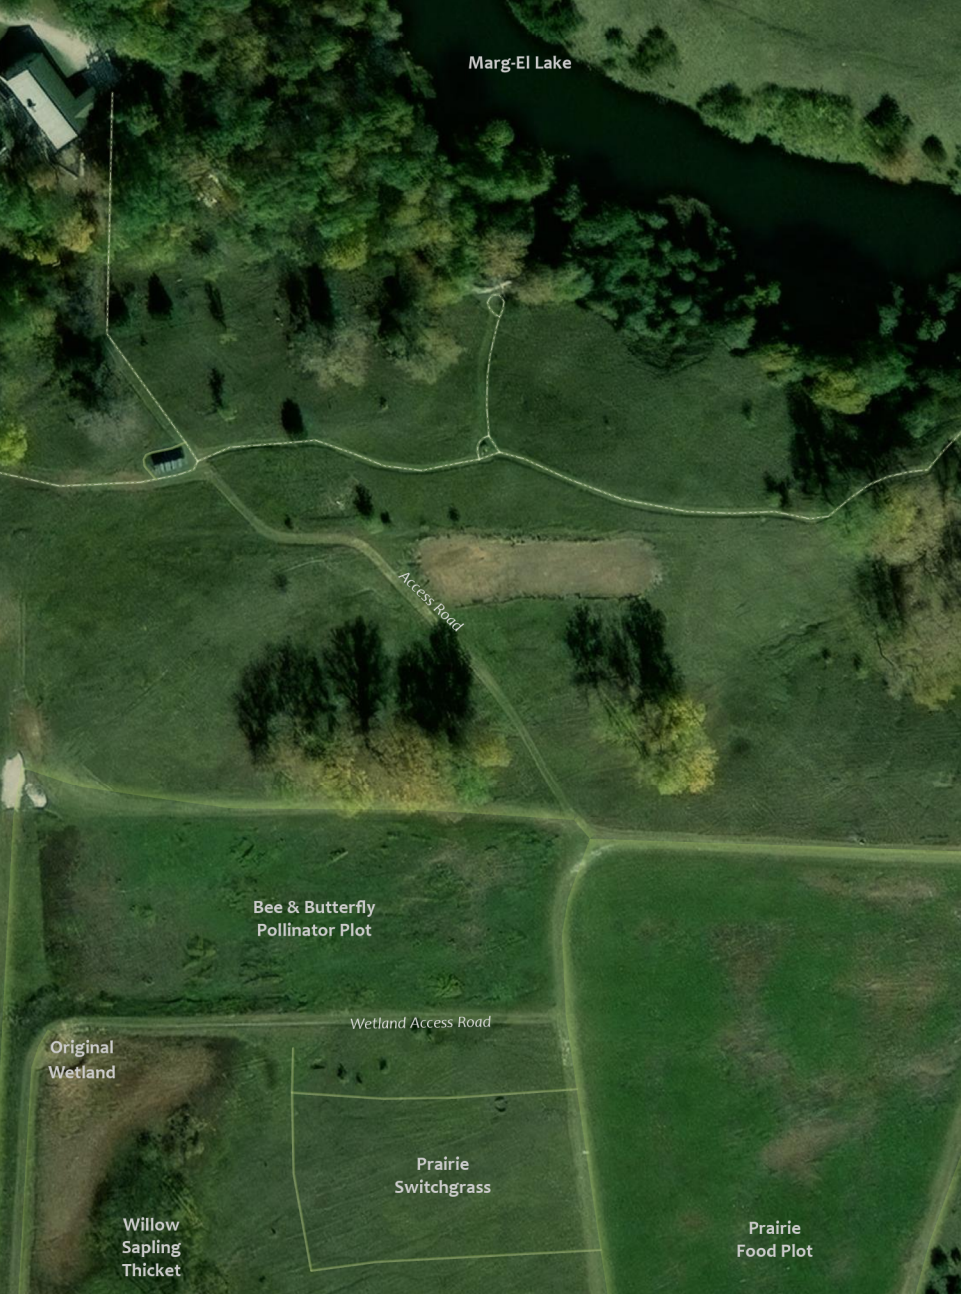
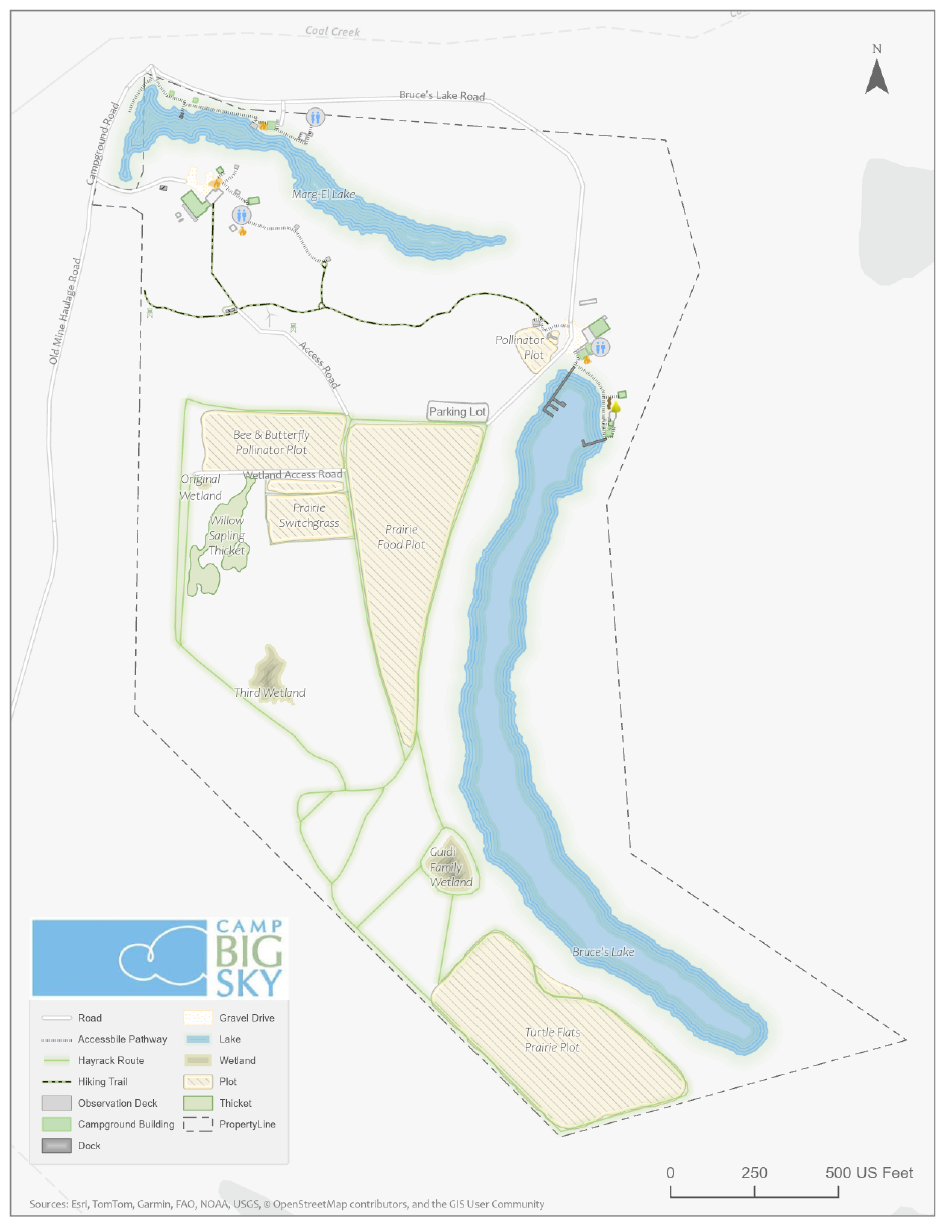
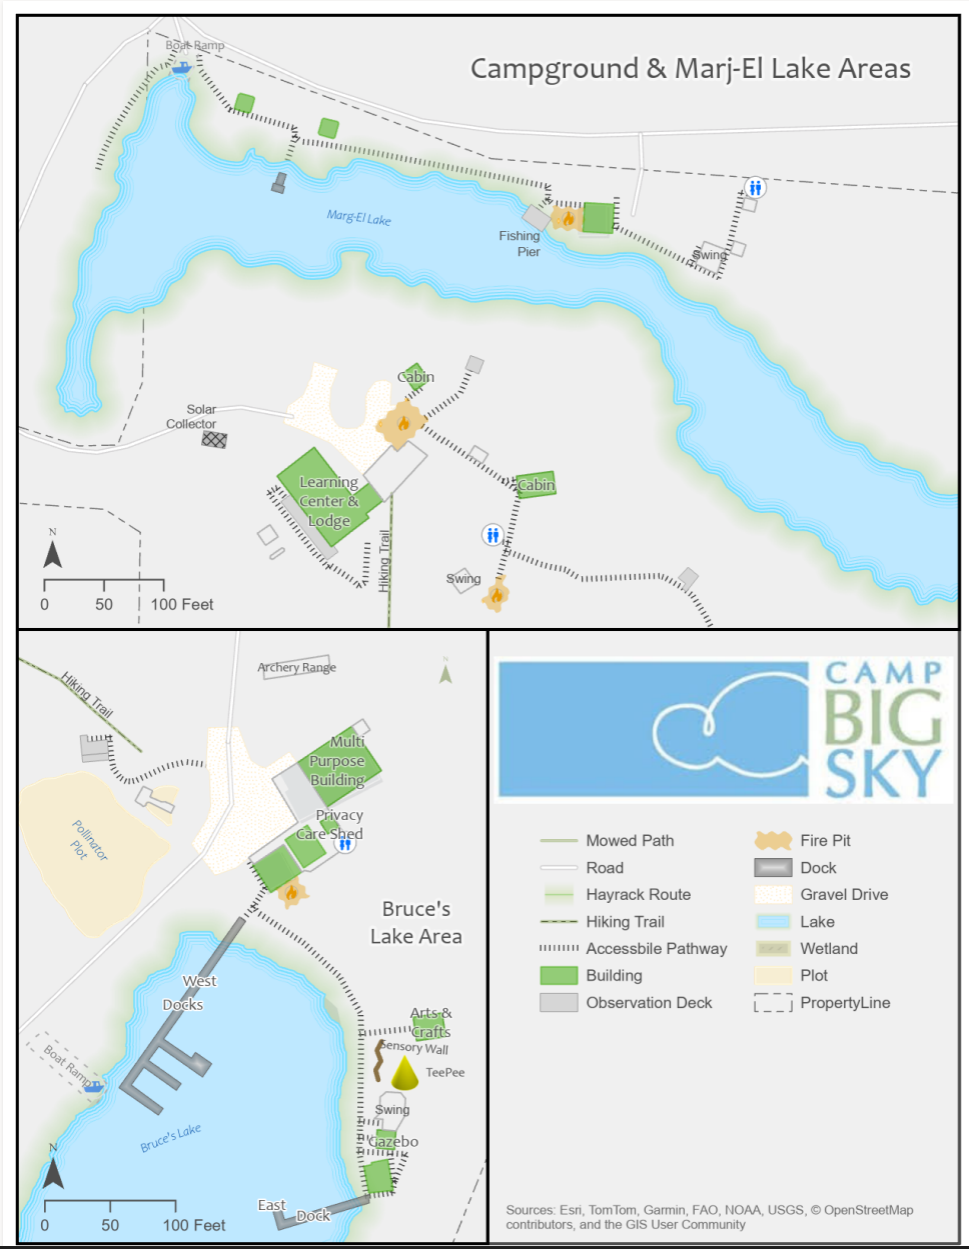
Using drone imagery, we captured high-resolution aerial views of the camp, allowing us to digitize important features with precision. This data forms the foundation of our maps, ensuring accuracy and detail.
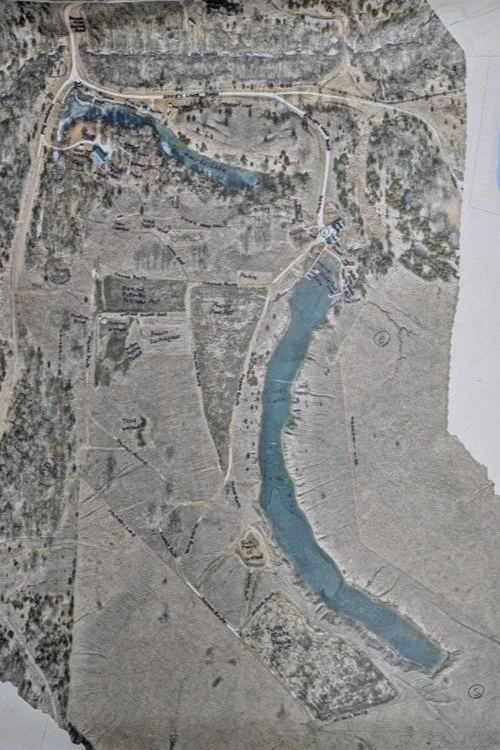
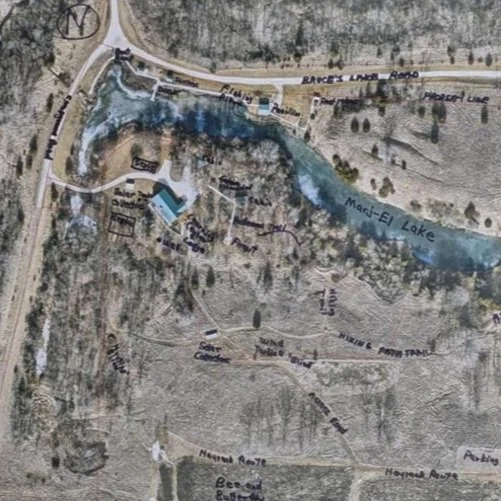
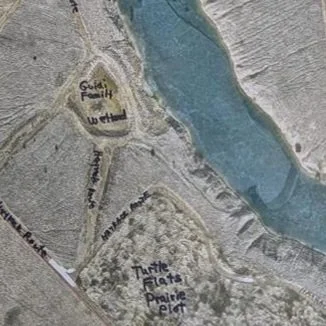
We provided the founder of Camp Big Sky, Brad Guidi, with a poster-sized printout of the aerial imagery. He identified the names of the features that had been digitized so that we could develop a GIS database that includes:
Natural features like lakes, trails, and tree cover.
Infrastructure elements such as buildings, parking areas, and accessibility features.
Points of interest that allow visitors and staff to both enjoy and navigate the camp more easily.
Mapping paper products like a wall map with great imagery or a 8.5 X 11 photocopy to hand out to visitors.
The Impact
These maps will help visitors, volunteers, and staff make the most of Camp Big Sky’s outdoor experiences. The GIS solution will also enable the organization to manage their property more efficiently and plan for future improvements. We have their GIS saved securely for continued updates or applications they may need.
By expanding beyond the original request for “a map,” we’re providing Camp Big Sky with tools that will help them enhance visitor experiences and support future growth and funding opportunities.
This project showcases how GIS technology can support nonprofits in meaningful ways, and we’re proud to contribute to Camp Big Sky’s mission.
To learn more about Camp Big Sky, visit their website at: https://campbigsky.org
If you have more question about how we can help you or your Organization with GIS, Contact us!
Reinforced Attendance.
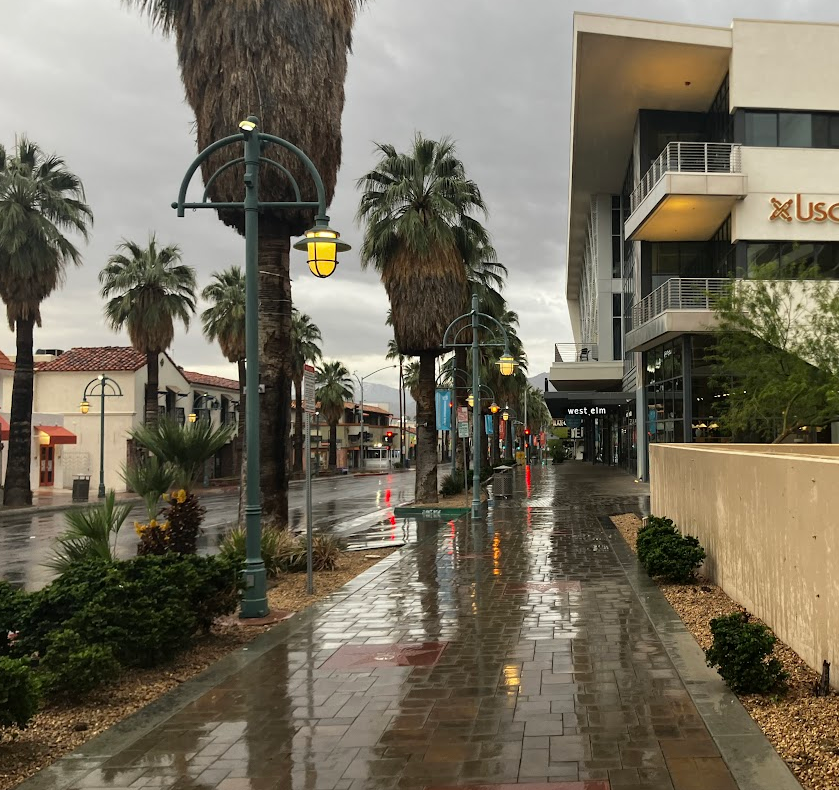
Earlier this March, I had the opportunity to attend the Esri Partner Conference (EPC) and Developer Summit (DevSummit) in Palm Springs, California. This marked my fifth time attending EPC. Every time I go, I’m reminded that while the sessions, product updates, and technical insights are invaluable, the real benefit lies in the connections and networking that happen throughout the event. It’s an experience that extends beyond the formal agenda—one that reinforces why attending these events is essential for any organization leveraging Esri’s technology.
Earlier this March, I had the opportunity to attend the Esri Partner Conference (EPC) and Developer Summit (DevSummit) in Palm Springs, California. This marked my fifth time attending EPC. Every time I go, I’m reminded that while the sessions, product updates, and technical insights are invaluable, the real benefit lies in the connections and networking that happen throughout the event. It’s an experience that extends beyond the formal agenda—one that reinforces why attending these events is essential for any organization leveraging Esri’s technology.
Plenary Session: Setting the Stage for Innovation
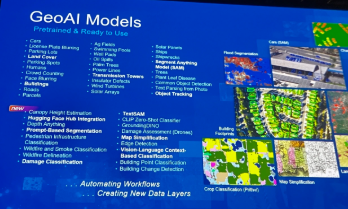
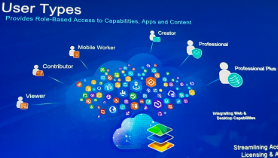
The Plenary Session at EPC is always a highlight, and this year was no different. Jack Dangermond kicked things off with his signature enthusiasm and deep insights about the future of GIS. The session showcased the latest updates to the ArcGIS ecosystem, with a strong emphasis on AI integration, ArcGIS Knowledge Graphs, and real-time geospatial analytics. It was exciting to see demonstrations of how ArcGIS Pro, Enterprise, and Online continue to push the boundaries of what’s possible in geospatial technology.
One of the standout demonstrations highlighted how ArcGIS Image Analyst and ArcGIS Pro are leveraging AI to detect and classify objects in imagery at unprecedented speeds. Another session explored how ArcGIS Knowledge Graphs and AI-driven link analysis are transforming how we analyze complex spatial relationships and networks. As AI continues to evolve, it’s clear that Esri is positioning its technology to empower organizations to harness these capabilities for more intelligent, data-driven decision-making.


Technical and Sales Sessions: A Balanced Approach
While the Plenary provided a glimpse into the future, I spent a significant portion of my time attending sales-focused sessions designed to help partners better promote Esri products and effectively sell geospatial services. These sessions were packed with insights on how to align Esri’s technology stack with client needs, demonstrate the value of enterprise GIS, and position services in a way that maximizes impact for clients.
One of the key takeaways was the importance of understanding customer pain points and tailoring solutions that address real-world challenges. Whether it’s highlighting the benefits of migrating to ArcGIS Online for improved collaboration or promoting the power of ArcGIS Enterprise for organizations requiring on-premises control, these sessions emphasized that successful selling is rooted in serving clients better. I also picked up valuable strategies for building long-term relationships with clients by offering managed services and ongoing GIS support—an approach that aligns perfectly with the goals of Maurer-Stutz Geospatial Services (MSGS).
The Real Value: Networking and Collaboration
As much as I enjoy the technical content, the most meaningful part of attending EPC and DevSummit is the networking. Being in Palm Springs with GIS professionals, developers, and partners from around the world creates countless opportunities to exchange ideas, solve challenges, and explore new partnerships. Whether it’s a chance encounter over coffee or a deeper conversation during a breakout session, these connections often lead to collaborations that drive real value long after the event ends.
This year, I had the opportunity to reconnect with old colleagues, meet potential partners, and strengthen relationships with other Esri partners. Conversations ranged from sharing best practices for enterprise GIS management to brainstorming ideas for integrating emerging technologies into our service offerings. These interactions are what make attending EPC and DevSummit more than just a learning experience—they make it an opportunity to build relationships that fuel growth and innovation.
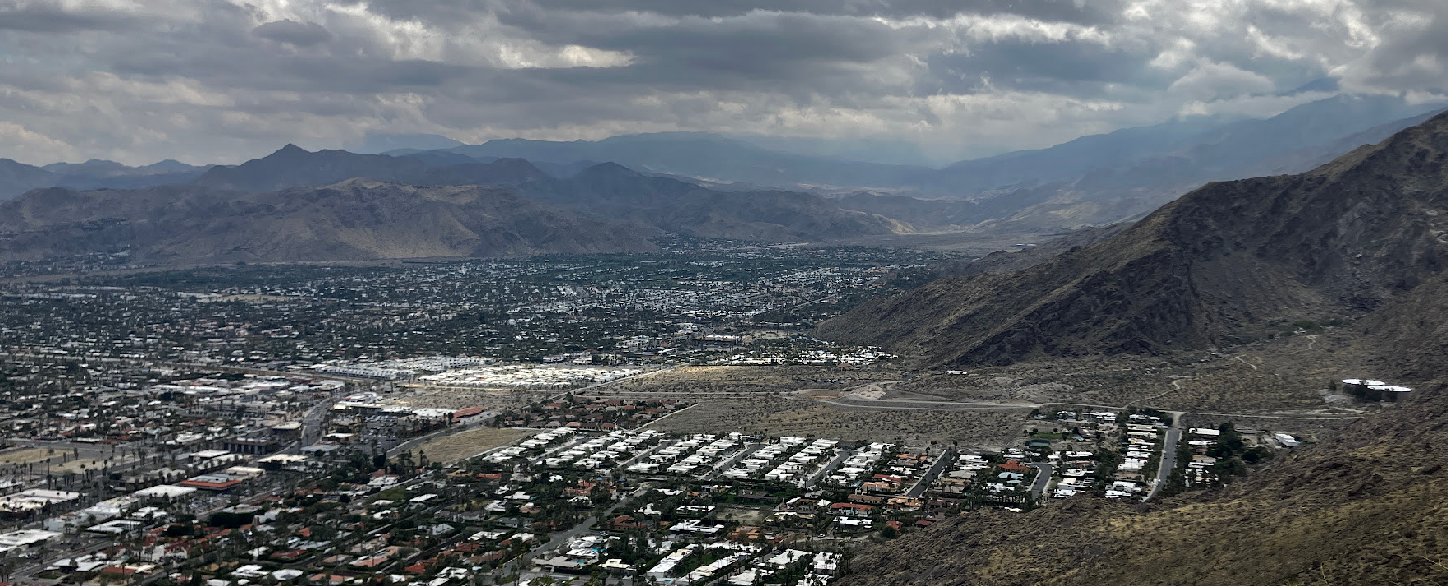
A Minor Perk: Escaping Central Illinois in March😉
Of course, I’d be remiss if I didn’t mention the minor perk of escaping the unpredictable weather of Central Illinois in early March. Palm Springs provides the perfect backdrop for a week of learning and networking, with its warm sunshine and stunning views of the San Jacinto Mountains. Even though it did rain for a day or two, it’s still a welcome change from the Midwest’s lingering winter, and it certainly adds to the appeal of making the annual trek to EPC and DevSummit.
Why I Keep Coming Back
After five EPCs, I can confidently say that attending is about more than just staying up to date with the latest GIS technology—it’s about being part of a community that’s shaping the future of geospatial innovation. The sessions provide the knowledge, but the connections provide the inspiration and momentum to apply that knowledge in ways that drive real impact.
If you’re considering attending in the future, I can’t recommend it enough. Whether you’re a developer looking to deepen your technical expertise, a business leader focused on expanding your GIS capabilities, or a partner aiming to better serve your clients, EPC and DevSummit offer a unique blend of learning, networking, and inspiration that’s hard to find anywhere else. Plus, a little sunshine in Palm Springs doesn’t hurt either.

Got Questions about this Blog? We can tell you what we know. Fill out the form below and we will get back to you as soon as we can. 
3275 Pixels is Plenty!
A recent project provided an unexpected yet valuable lesson in troubleshooting and understanding the limits of modern web mapping applications. In this post, we walk through our journey from a successful ArcGIS Enterprise 11.3 installation to unearthing a surprising resolution related to the Experience Builder’s map element size.
We recently completed a major installation of ArcGIS Enterprise 11.3 for a client, which included a complete data migration into their new system. Utilizing ArcGIS Pro, we published layers from their database directly to their new portal. Everything was set up for a seamless experience—until an unexpected issue emerged.
The Alignment Issue
After deploying the webmap in an Experience Builder application, our team noticed that the map layers were not aligning correctly with the basemap. Here’s what we observed:
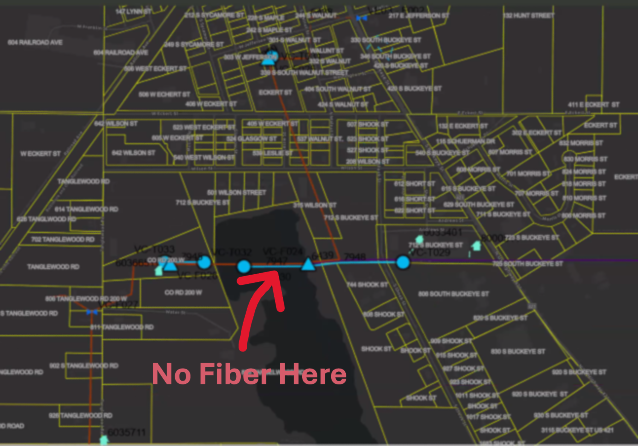
The image above is intentionally fuzzy.
Consistently Inconsistent: Despite verifying projections and coordinate systems, every republish of the map layers resulted in misalignment in the ArcGIS Portal webmap. The fiber network feature seemed to ‘hop’ around the map space.
Conflicting Results Across Devices:
The client’s computer exhibited persistent alignment issues.
Interestingly, when we accessed the portal on our systems, as well as on an iPad or another user’s computer, the map data aligned perfectly.
This inconsistency was perplexing and demanded deeper investigation.
The Debugging Journey
We began by rechecking every variable that could influence map rendering:
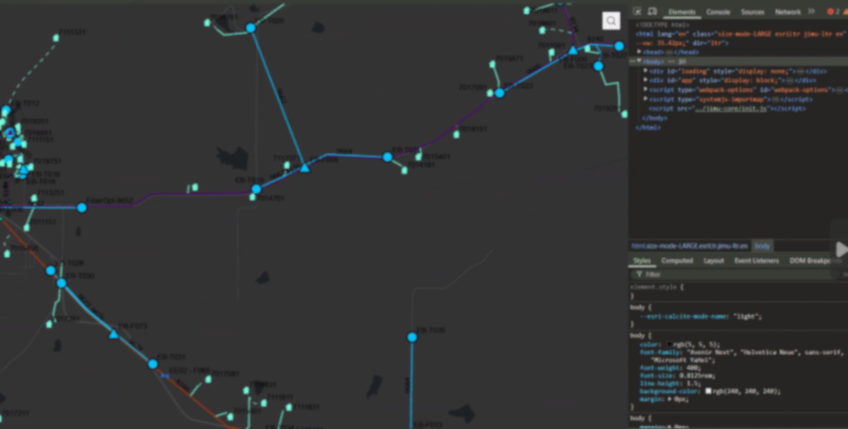
The image above is intentionally fuzzy.
Revalidating Projections and Coordinate Systems:
We double-checked all spatial references, confirming that there were no discrepancies that could cause the misalignment.Republishing Multiple Times:
Despite several attempts and republishing sessions, the misalignment persisted on the client’s main system.Browser and Cache Considerations:
We had the client try different browsers and even cleared browser caches—none of which resolved the issue.A Surprising Discovery with Developer Tools:
The breakthrough came when we noticed that opening Chrome Developer Tools seemed to “correct” the alignment. This was a critical hint that the issue might be related to the browser’s rendering dimensions.
The Root Cause: Screen Resolution and Size Limits
Digging deeper, we discovered that the primary client’s workstation featured a 49" wide screen with a resolution of 4216 x 976 pixels. When the browser window was resized (as it often is when opening Developer Tools), the map data would align properly.
After thorough testing, we pinpointed the issue to a specific limitation: the Experience Builder application’s map element appears to have a maximum width limit for properly displaying a mapping service. Our tests revealed that:
A Webmap element set to 3280 pixels would not align correctly.
Once we reduced the width to 3275 pixels, the map aligned perfectly.
This finding confirmed that the Experience Builder webmap element has a hard limit of 3275 pixels. Exceeding this limit can lead to unexpected rendering issues like the one we experienced. This is our experience, your results may vary.
Lessons

Screen Resolution Matters:
Large monitors and high-resolution screens can expose limitations in web application design that might not be apparent on standard displays.
Dynamic Testing Can Reveal Hidden Issues:
Simple actions like opening Developer Tools, which resize the browser window, can provide clues about underlying layout constraints.Set Explicit Limits:
When designing applications in Experience Builder, consider setting maximum element widths to prevent layout issues across different devices and screen sizes.Document Your Findings:
Sharing insights like these can help other developers avoid similar pitfalls and contribute to a more robust design for web mapping applications. We’re all swimming the dark, your discovery may open the door for someone else.
While our initial installation and data migration were successful, the misalignment issue provided an opportunity to dive deep into the nuances of Experience Builder’s rendering behavior. Understanding that a pixel limit of 3275 exists for the webmap element not only helped resolve our client’s issue but also highlighted the importance of considering display dimensions during application design.

GIS for PLS at IPLSA in SPI
Earlier this month at the 2025 Illinois Professional Land Surveyors Association (IPLSA) conference, I had the opportunity to present What is GIS? in Springfield, Illinois. The session aimed at breaking down the fundamentals of Geographic Information Systems (GIS) and showing just how much this technology does beyond simply making maps. My goal was to help attendees understand the real power of GIS in infrastructure planning, data management, and decision-making across industries.
Geospatial > The Layer File > GIS for PLS at IPLSA in SPI
Exploring GIS at IPLSA 2025: A Look into the Future of Geospatial Technology
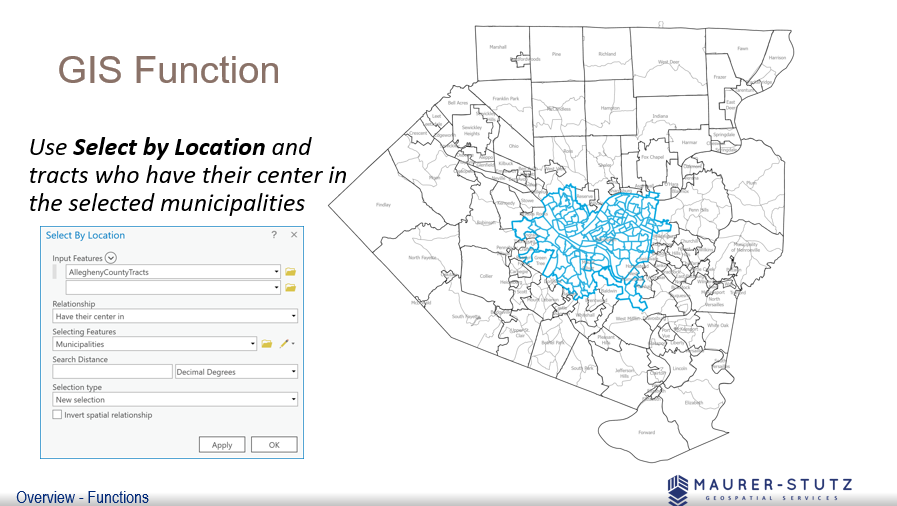
We covered the basic functions of GIS
Earlier this month at the 2025 Illinois Professional Land Surveyors Association (IPLSA) conference, I had the opportunity to present What is GIS? in Springfield, Illinois. The session aimed at breaking down the fundamentals of Geographic Information Systems (GIS) and showing just how much this technology does beyond simply making maps. My goal was to help attendees understand the real power of GIS in infrastructure planning, data management, and decision-making across industries.
To start, I walked through the basics of GIS—how spatial data is collected, stored, analyzed, and visualized. We covered coordinate systems, geodatabases, and why data accuracy is crucial in GIS workflows. This foundation set the stage for diving into real-world applications, where GIS helps land surveyors, civil engineers, transportation planners, and public works professionals work more efficiently.
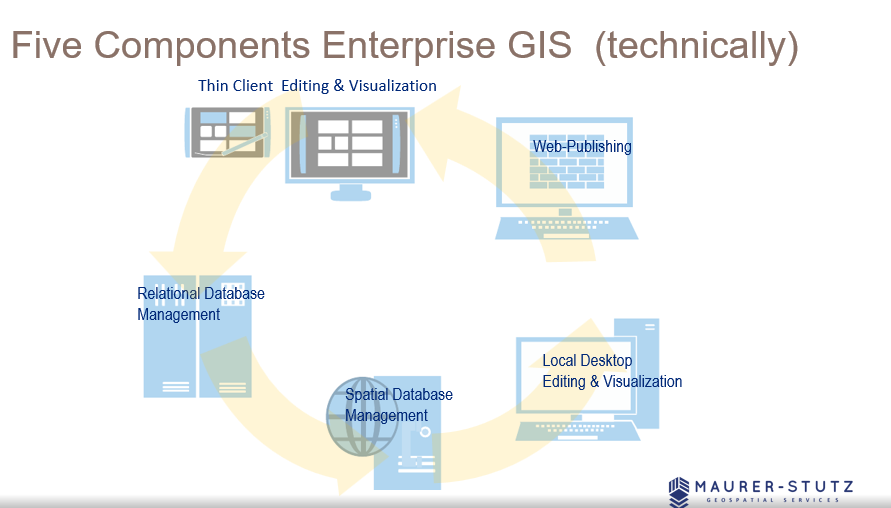
There are 5 components to make GIS an ‘enterprise GIS’
One of the most exciting parts of the presentation was showing off how GIS is used in municipal projects, transportation networks, and utility management to improve efficiency and accuracy. It was great to see the room engage with examples of how GIS lets us visualize changes over time, analyze trends, and make better decisions—whether it's tracking road conditions, mapping flood zones, or planning infrastructure upgrades.
We also talked about Enterprise GIS solutions and cloud-based GIS platforms, explaining how organizations use geospatial databases to streamline their operations. Cloud-based systems like ArcGIS Enterprise are game-changers, keeping data accessible and up-to-date for teams across departments.
Looking ahead, I touched on some exciting innovations in GIS, including Artificial Intelligence (AI) and machine learning in spatial analysis, real-time data integration with IoT sensors, and participatory GIS for public engagement. It’s incredible how GIS is evolving to include more automation and real-time data, making it even more valuable for decision-making.
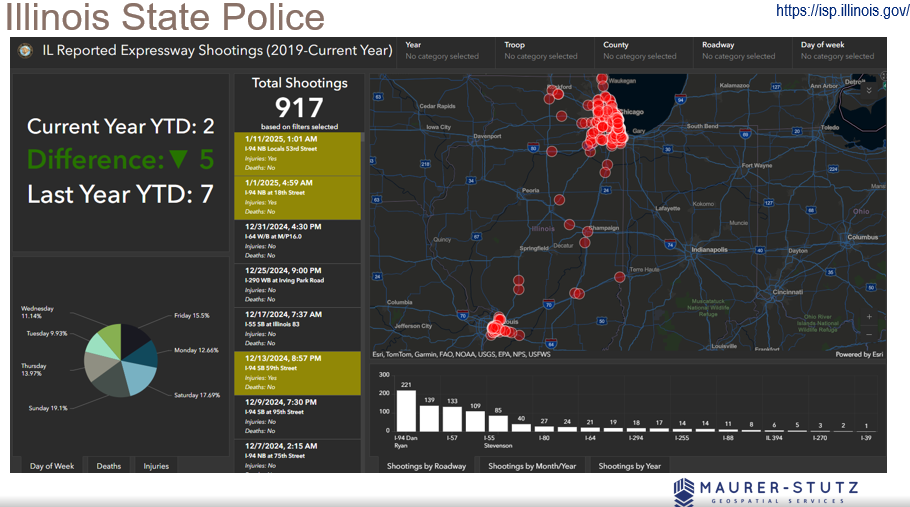
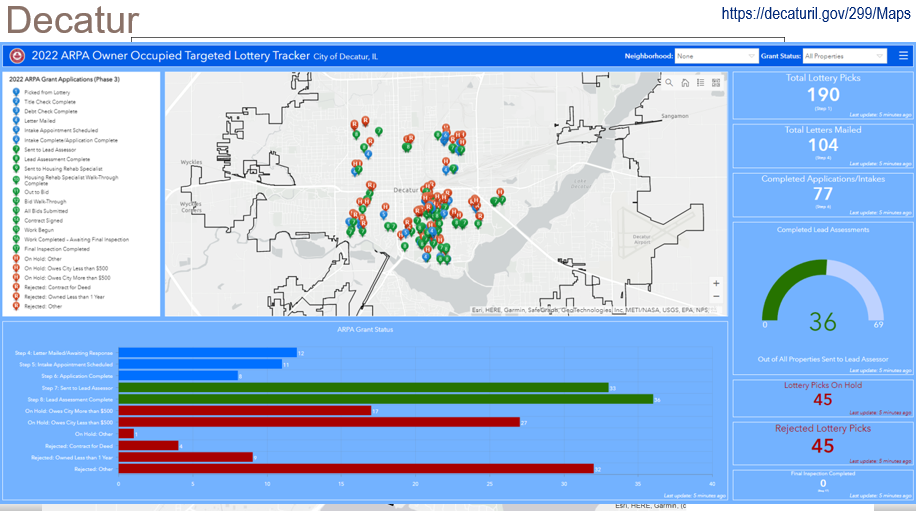
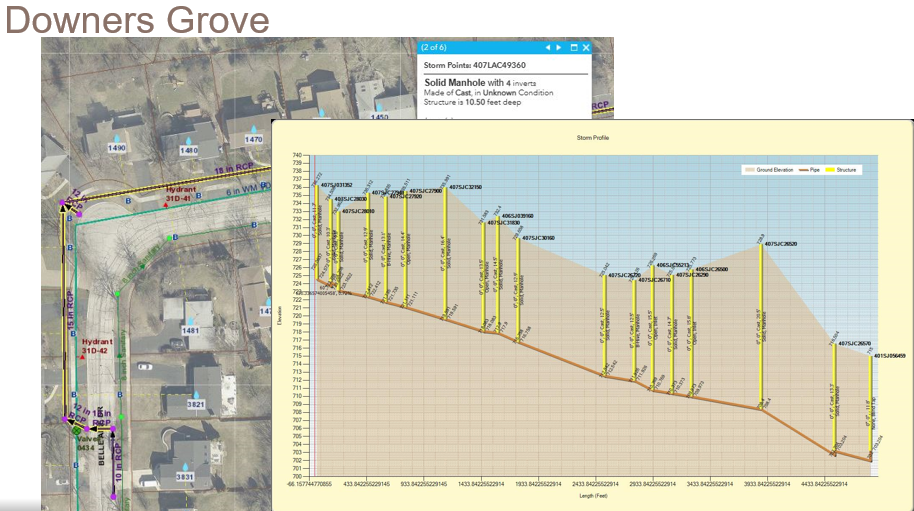
I had some great help from ILGISA friends around the state. I spent most of the time looking at these examples.
The key takeaway from the presentation is that GIS offers a vast range of possibilities, but it also requires a deep understanding of its technical complexities. By appreciating the skill and expertise involved, professionals can develop greater respect for GIS specialists and recognize the value they bring. Ultimately, fostering collaboration rather than opposition will lead to more effective and innovative solutions in the industry.
GIS is constantly evolving, and its impact reaches far beyond mapping—it’s about making smarter, data-driven decisions that shape our communities. Presenting at IPLSA 2025 was a great opportunity to share that message and connect with others who are just as passionate about geospatial technology as I am. The presentation is Here.
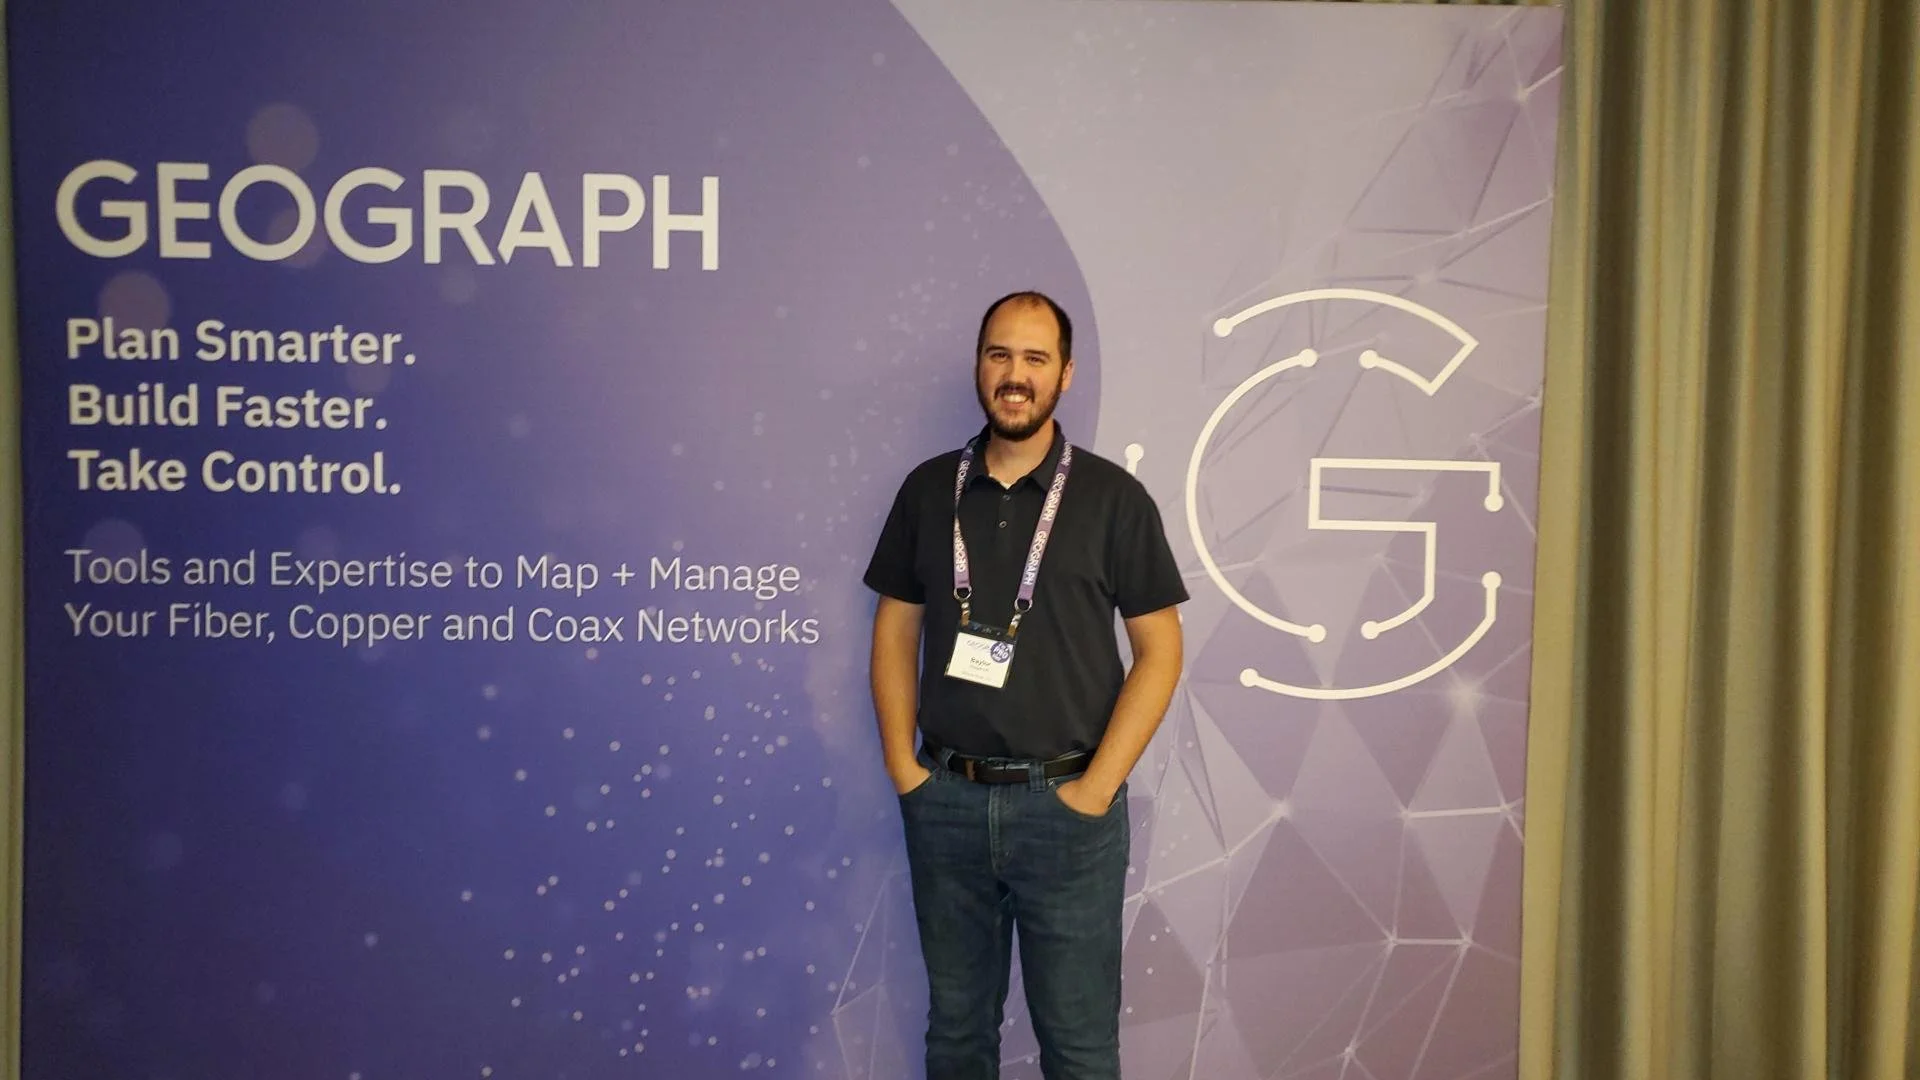
It's Official! MSGS and GEOGRAPH Partnership Announcement
Our Geospatial Services group is thrilled to announce a significant milestone—a strategic partnership with GEOGRAPH Technologies! GEOGRAPH Technologies is a leader in the fiber utility geospatial technology sector, known for developing CrescentLink, a powerful telecommunications asset management software add-in for ArcGIS Pro. Our expertise in Enterprise GIS and consultant GIS services complements their product, creating a collaboration that will amplify the value they deliver to their customers. Stay tuned as we share more about specific projects and successes stemming from this partnership!
Geospatial > The Layer File > MSGS and GEOGRAPH Partnership Announcement


Our Geospatial Services group is thrilled to announce a significant milestone—a strategic partnership with GEOGRAPH Technologies! This collaboration marks a new chapter in delivering cutting-edge geospatial solutions to the fiber broadband industry in alignment with our mission to provide innovative and impactful engineering and consulting GIS services.
Why GEOGRAPH Technologies?
GEOGRAPH Technologies is a leader in the fiber utility geospatial technology sector, known for developing CrescentLink, a powerful software add-in for ArcGIS Pro. CrescentLink is specifically designed to manage telecommunication infrastructure data, with a focus on fiber connectivity networks. Our expertise in Enterprise GIS and consultant GIS services complements their existing product offering, creating a collaboration that will amplify the value they deliver to their customers. Both Micah and Baylor were first introduced to CrescentLink and the GEOGRAPH team during they tenure in the Fiber Broadband industry, and can attest to its ease of use and robust suite of tools for managing fiber broadband connectivity information.
Shared Values and Vision
At the core of this partnership is a shared commitment to innovation, excellence, and client/customer success. Both of our teams are driven by the goal of empowering each organization with the tools and insights needed to solve real-world challenges in the telecommunications industry. GEOGRAPH views this as a "both parties forward" arrangement, with MSI/MSGS branding present on sales media and MSGS staff included in prospective customer meetings.
All work performed by MSGS on behalf of GEOGRAPH will be routed through a subconsultant Master Services Agreement between the two firms. GEOGRAPH and their team of dedicated Account Managers and Professional Services staff will continue to act as the primary point-of-contact for their customers; facilitating all customer quoting, invoicing, as well as project management. This streamlined arrangement helps us focus on delivering high quality GIS consulting services to their customers without administrative burden on either party.
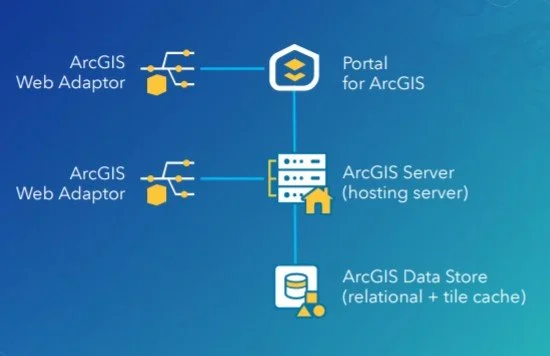
ArcGIS Enterprise Base Deployment Schematic
What This Partnership Means for MSGS
Our subconsultant partnership with GEOGRAPH Technologies is mutually beneficial:
Tailored Solutions: By combining GEOGRAPH’s robust tools with our industry knowledge in Enterprise GIS, we can develop tailored solutions to meet the unique needs of their clients in the telecommunications industry and beyond!
Enterprise GIS: This collaboration will initially focus on completing Enterprise GIS Deployments for GEOGRAPH’s customers, including the implementation and integration of CrescentLink into the customer’s broader GIS/IT ecosystems. These efforts will address a strategic need for their customers, as it is a prerequisite requirement to using their CrescentLink platform.
Geospatial Solutions Plans (GSPs): In addition to our Enterprise Deployment services, GEOGARPH Customers can purchase prepaid blocks-of-hours on a subscription-based model. These flexible plans can be used for nearly any GIS consulting task, including geodatabase management, basic script development, training, and more. The GSP provides an efficient way to access expert support tailored to the customers unique geospatial consulting needs.
“The team at GEOGRAPH is nothing short of fantastic to work with. They care deeply about their customers and have an exceptional product [CrescentLink] for managing telecommunication plant assets and connectivity information. We look forward to working closing with them to help their customers get the most out of the CrescentLink deployments. ”
Looking Ahead
The entire MSGS Team is humbled by the trust and relationship that we are developing with GEOGRAPH. We’re already working closely on several smaller pilot projects, with many more in their sales funnel. Stay tuned as we share more about specific projects and successes stemming from this partnership!
Introducing: Geospatial Solutions Plans
Maurer-Stutz Geospatial Services is excited to introduce our newest contracting solution, Geospatial Solutions Plans! These subscription-based, block-of-hours contracts are idea for organizations large and small that need the flexibility of a top tier geospatial consultant on demand.
Geospatial > The Layer File > Geospatial Solutions Plans

At Maurer-Stutz, “Working with you by design” is more than just a motto—it’s a promise. We believe every organization’s challenges are unique, and so are the solutions needed to address them. In the consulting world, this has typically meant project-based contracts reign supreme – scopes and costs are defined up-front with little wiggle room for change without renegotiation.
While these types of contracts certainly have their place, what if you don’t know what your needs are in advance? Is a fixed contract the best use of your organization’s time and resources? In some cases, long-term contracts and one-size-fits-all projects can leave you feeling boxed in.
Dynamic organizations deserve a partner that can be dynamic with them. That’s why at MSGS we’ve introduced our Geospatial Solutions Plans (GSPs): a flexible, subscription-based consultant model that delivers high-level GIS expertise through pre-paid blocks of hours.
With our GSPs, you’ll enjoy budget certainty, scalable support, and the peace of mind that comes from having a dedicated partner by your side—one who truly understands your vision and is ready to adapt to your evolving needs. In this blog, we’ll show you how working together by design leads to better, more responsive geospatial solutions, no matter your organization or industry focus.
What Are Our Geospatial Solutions Plans (GSP)?
Our GSPs are contracts designed for clients that need top-tier geospatial expertise without the stringent commitments of traditional, project-based agreements. With our subscription model, you purchase a block of consulting hours that you can use as needed throughout the plan year.

This means:
Flexible Support: Access expert advice and technical support on demand.
Cost Predictability: Know your expenses upfront with a pre-paid block of hours.
Scalable Engagement: Adjust the level of support as your project needs evolve.
How the Subscription Model Works
When engaging customers on our GSPs, we start with a thorough onboarding process to understand your unique challenges and goals. Here’s what you can expect:
Initial Consultation & Needs Assessment:
Before anything is signed, we will discuss your objectives and current geospatial challenges. This step ensures that the GSP plan level is tailored to your requirements. Our goal is to “right size” the package to fit your anticipated needs.Customizing Your Service Package:
Based on this assessment, we recommend a subscription level (block of hours) that fits your organization’s scope. These hours can be used for a wide variety of GIS consulting services across many different industries (examples below!).Subscription Check-Ins:
We schedule regular check-ins to make sure your organization’s needs are being met efficiently and effectively. This iterative process helps us fine-tune our solutions and ensure continuous improvement throughout the life of the subscription. If your organization is finding value in our consulting services, you can move to a higher plan level as needed.
Renewal
The GSP is an annual subscription. We will never force you to use your consulting hours, and unused hours will roll over to the next subscription plan year. You have the freedom to use them on smaller projects or save them for several years.

Tailored Services That Fit Your Industry
With our Geospatial Solutions Plans, you get full access to our skilled team of dedicated developers, GIS Analysts/Professionals, and Enterprise Administrators who are ready to meet the specific needs of your organization. From Municipal Governments, to Engineering Consultants, to Fiber Broadband Providers, we have the right combination of talent and experience to provide a wide variety of geospatial consulting services.


ESRI Utility Networks
ArcGIS Online Administration
Infrastructure Asset Inventories
Cadastral & Administrative Data Management
Custom Maps, Apps, and Dashboards
ArcGIS Hub Sites and ArcGIS Solutions Deployments
Authoritative Data sourcing & truthing
GIS/CAD/Survey Integrations
JULIE Design Tickets
Geospatial Analysis
Engineering Modelling Inputs
Custom Field Data Applications
Map and Data Report Deliverable Development
ArcGIS Enterprise Deployments
Database Maintenance & Cleanup
Splice Record Imports
Custom Scripting
3rd Party Integrations
Construction Planset Templates
The Benefits of a Block-of-Hours Model
Choosing our subscription-based GSPs means embracing a new level of flexibility and partnership:

On-Demand Expertise: No need to commit to a rigid scope-defined contract—use your hours whenever the need arises.
Predictable Budgeting: With pre-paid hours, you can manage expenses more effectively without unexpected costs. GSPs are calculated based on a discounted average hourly rate when compared to straight time/material contracts. This translates into savings for your organization over the life of the subscription.
Managed Services: For those customers that need ongoing support and maintenance of their GIS deployments, we offer Managed Services within our higher GSP plan levels. This service guarantees weekly check-ins to your infrastructure for performance, maintenance and longevity tasks to keep your GIS deployments running smoothly.
Long-Term Partnership: This model fosters a close, ongoing relationship that allows us to develop a deep understanding of your organization and its geospatial needs.
Ready to Transform Your Business?
If you’re looking to harness the full potential of your geospatial data, our Geospatial Solutions Plans offer a smart, flexible alternative to traditional consulting contracts.
Contact us today for a consultation or to schedule a demo, and discover how our tailored, expert support can drive your business forward.

Shared Update is Shared Administration
Here’s the setup: You’ve carefully crafted a web map and application in ArcGIS Online. The data is perfect, the configurations are solid, and you’re ready to share it with your team. But then, you notice something alarming — edits are possible when they shouldn’t be. Despite your best efforts to lock things down, the data is still editable in ways you may not want. This was the exact situation we faced recently. Here’s how we untangled the mystery and discovered (via tech support) a hidden pitfall in group permissions that every ArcGIS Online user should know about.
Geospatial > The Layer File > Shared Update is Shared Administration
Preventing Unwanted Edits in ArcGIS Online: A Support Case Story
Here’s the setup: You’ve carefully crafted a web map and application in ArcGIS Online. The data is perfect, the configurations are solid, and you’re ready to share it with your team. But then, you notice something alarming — edits are possible when they shouldn’t be. Despite your best efforts to lock things down, the data is still editable in ways you may not want.
This was the exact situation we faced recently. Here’s how we untangled the mystery and discovered (via tech support) a hidden pitfall in group permissions that every ArcGIS Online user should know about.
It’s right there! Just click it!
The Puzzle Begins
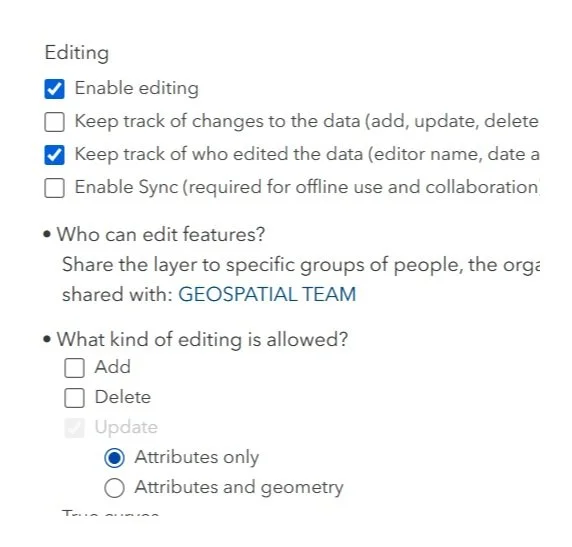
Our journey started with two accounts: an admin account and a creator role responsible for Editing ATTRIBUTES of a hosted feature layer in an Experience Builder application. Our goal was simple:
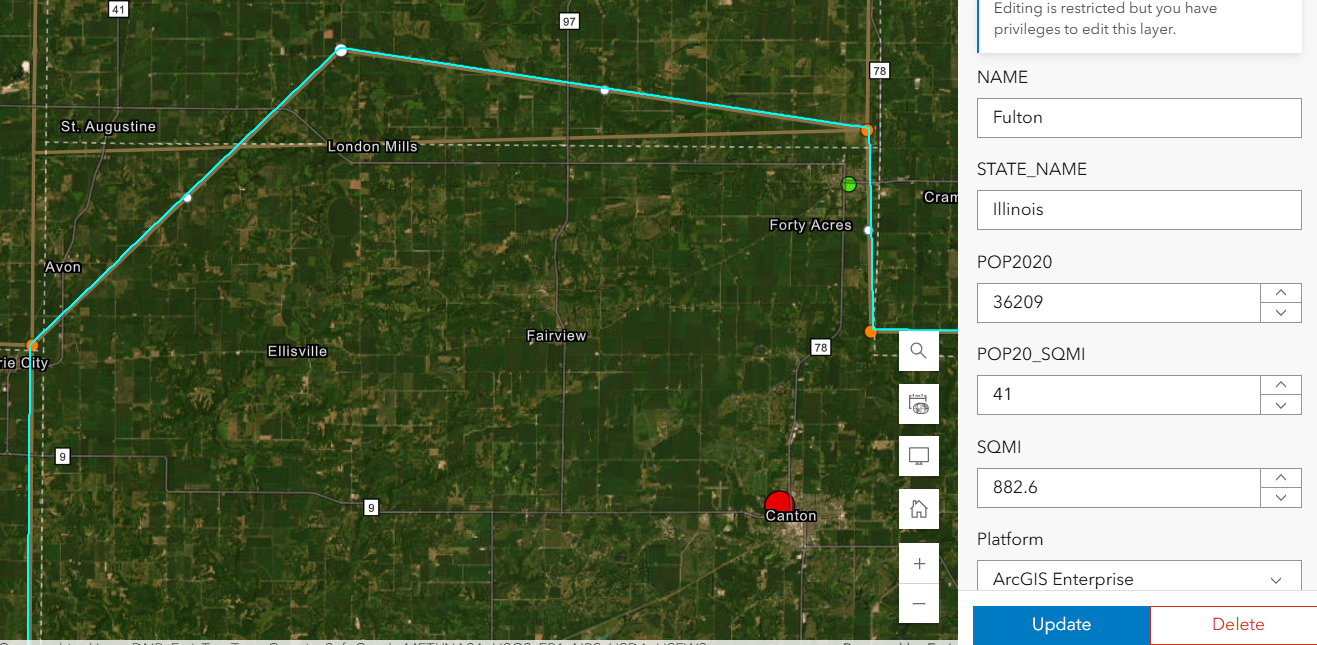
Welp. That’s not supposed to happen….
Prevent Geometry Changes except for the admin or data owner. No sweat right? Just set that variable in the Feature layer’s settings. Done- Duh.
Except, after using the Admin to set that option , my Creator user could still add, delete and change the geometry.
We double-checked everything:
Just for fun, we totally disabled editing in the hosted feature layer settings — check.
The Experience Builder edit widget was configured to prevent edits — check.
Yet, somehow, edits were still possible. It didn’t make sense. We were sure we had all the right settings in place, but the problem persisted. The Creator user could edit vertices in the webmap AS WELL AS resize polygons in the Experience Builder application. In fact that Creator user could change these settings as well as add fields or enable attachments on a layer it did not own.
Digging Deeper
After some thorough troubleshooting with Esri Tech Support, the only commonality was that the users were both a part of the same group. The web map, app, and layers were all shared with this group — a shared update group, to be exact.
For those unfamiliar, shared update groups are powerful collaboration tools in ArcGIS Online. They allow multiple people to edit items shared within the group. However, with great power comes great responsibility (and a potential for unintended consequences).
Esri’s documentation on creating groups carries this important caution:
Caution: A shared update group allows all members to edit items shared with the group. Be careful when enabling this capability, as it overrides individual item settings for editing. …members of this group also have elevated privileges, such as the ability to edit the contents of hosted feature layers, append and update a hosted feature layer using the content of a file, alter editor tracking settings, enable or disable attachments, and alter the layer's schema.

Despite our feature layer and widget settings, the shared update group’s permissions were overriding everything, allowing geometry edits to slip through. The fact that the setting disallows adding, deleting, or changing geometry, means nothing. The layer being shared with a ‘shared update’ group overrides ALL those settings!
Finding the Solution
With this realization, the path forward became clear. We needed to change how we were sharing the content. Here’s what we did:
Created a new group without shared update privileges.
Shared the web map and app with this new group instead.
Tested it — and this time, with the same user, no unwanted geometry edits!
By removing the shared update capability, we ensured that only the admin or data owner could make changes. The issue was finally resolved.
This experience highlighted an important lesson about managing permissions in ArcGIS Online:

Shared update groups are powerful but can lead to unintended edits. If you don’t need collaborative editing, avoid using shared update groups. Stick to regular groups to keep your content secure.
Taking a moment to review your group settings can save you from unexpected headaches. It’s a subtle but critical detail that can make all the difference in protecting your data.
In the world of geospatial data, collaboration is essential, but so is control. Understanding how permissions work — and how group settings can override individual item configurations — is key to successful content management in ArcGIS Online. Next time you set up a web map or app, ask yourself: Who really needs editing privileges?
Choose your groups wisely, and your data will stay secure.
If you ever find yourself puzzled by permissions, remember: We are here to help you unravel the mystery.

ArcGIS Earth Actually Isn't That Bad!
When I first explored ArcGIS Earth, I wasn’t expecting much—it’s a free tool from Esri that looks like a Google Earth clone. But after using it for a while, I’ve come to appreciate its unique capabilities, even if it’s not perfect. ArcGIS Earth is surprisingly good at allowing users to quickly visualize and interact with spatial data in 2D and 3D. It supports a variety of formats, including KML, shapefiles, and imagery, making it versatile for simple GIS viewing needs.
Geospatial > The Layer File > ArcGIS Earth Actually Isn’t That Bad
When it comes to free GIS applications, expectations should be modest—but ArcGIS Earth is trying to defy the norm. Despite its somewhat modest reputation and certain rendering limitations, this tool offers a surprisingly robust experience for visualizing and interacting with geospatial data in 2D and 3D. Designed for both desktop and mobile environments, ArcGIS Earth provides intuitive capabilities for viewing most GIS files, conducting quick analyses, and navigating large datasets, all on a global scale.
This past ILGISA conference I gave a presentation called. “The Best GIS Viewer You're Probably Not Using” all about ArcGIS Earth. The presentation is here, but the best way to experience it is to just dive in.
ArcGIS Earth supports a wide range of formats, from shapefiles to KML/KMZ, GPX, and even OGC web services, allowing users to work with various data types seamlessly. Its 3D-first design also enables interactive analysis tools like line-of-sight views and elevation profiles, making it easier to plan and collaborate across teams, especially in infrastructure or environmental projects. You can customize the experience further to fit organizational workflows, enhancing usability and reducing the steep learning curve often associated with GIS software.
Customization
One of its standout capabilities is the ability to configure the application using custom configuration files. This feature allows administrators to tailor user experiences by adjusting default settings, defining data sources, and controlling functionality based on organizational needs. These customizations ensure a consistent environment across teams, aligning ArcGIS Earth with specific project or enterprise requirements. A configuration file can be saved on a shared drive or even online.


Another useful feature is the option to save and share workspaces. Users can preserve their current map views, layers, and data configurations as workspaces, enabling easy retrieval and continuation of projects. This functionality streamlines collaboration by allowing users to share complex setups with colleagues, ensuring consistent visualization and analysis across teams. Together, these tools make ArcGIS Earth more flexible and user-friendly, accommodating both individual customization and team-based workflows
Summary
Despite some challenges with performance, particularly in rendering complex 3D datasets or point clouds, the platform excels in simplicity and accessibility. Its integration with ArcGIS Online and Enterprise allows you to share maps, sync data, and perform edits collaboratively across devices—whether you're in the office or out in the field. For many, ArcGIS Earth serves as a valuable entry point into advanced GIS tools or a convenient option for lightweight tasks that don't require the full power of ArcGIS Pro.
NOTE: Version 2.3 is slated for release in December of 2024 and should have a good set of upgrades (including performance updates and Survey123 integration)
Overall, ArcGIS Earth is more than just a free viewer; it's a practical, surprisingly capable solution for organizations looking to add a dynamic data and a 3D perspective to their workflows.
From Maps to Meaning: Celebrating GIS Day
Join us on November 20 for GIS Day, part of American Association of Geographers’ Geography Awareness Week, as we celebrate the impact of Geographic Information Systems in solving real-world challenges! Established by Esri in 1999, GIS Day brings together GIS professionals, students, and curious minds worldwide to showcase how mapping technology helps us understand and improve the world around us.
Geospatial > The Layer File > From Maps to Meaning
Celebrate GIS Day on November 20, 2024, and Explore the Power of Maps!

Join us on November 20 for GIS Day, part of American Association of Geographers’ Geography Awareness Week, as we celebrate the impact of Geographic Information Systems in solving real-world challenges! Established by Esri in 1999, GIS Day brings together GIS professionals, students, and curious minds worldwide to showcase how mapping technology helps us understand and improve the world around us. This year, I'm honored to speak at the McLean County GIS Consortium’s event, where we’ll explore the latest in GIS technology, real-life applications, and the future of spatial insights. From interactive exhibits to live demos, the event promises something for everyone, whether you're a GIS pro or simply fascinated by the world of maps.
GIS Day encourages us all to appreciate geography's role in our lives and its transformative power, from smart city planning to disaster response. As part of Geography Awareness Week, it's a perfect chance to learn about GIS and connect with others who are passionate about mapping solutions for a better world. To learn more about the event and register, visit the McLean County GIS Consortium’s page.
Let's celebrate the role of GIS in building a more connected, informed, and resilient world—see you there!
ILGISA 2024 Recap
The ILGISA 2024 Conference presented a comprehensive slate of sessions, workshops, and panels aimed at advancing GIS practices, tools, and knowledge-sharing for professionals across sectors. A significant theme was the usage of Esri software to address real-world challenges in local government, environmental management, utilities, transportation, and infrastructure.
Geospatial > The Layer File > ILGISA 2024 Recap

Last week, the entire MSGS staff attended the 2024, Illinois GIS Association annual conference in East Peoria. Attending the ILGISA Annual Conference as a full team provides MSGS with an excellent opportunity for professional growth, networking, and skill enhancement within the Illinois geospatial community. A few days before, we banded together to cover as many of the sessions as we could, some of interest and some to align with projects. Through sessions that cover GIS applications in transportation, utilities, and environmental projects, the team can acquire valuable insights directly applicable to MSGS’s focus areas. See the full agenda Here

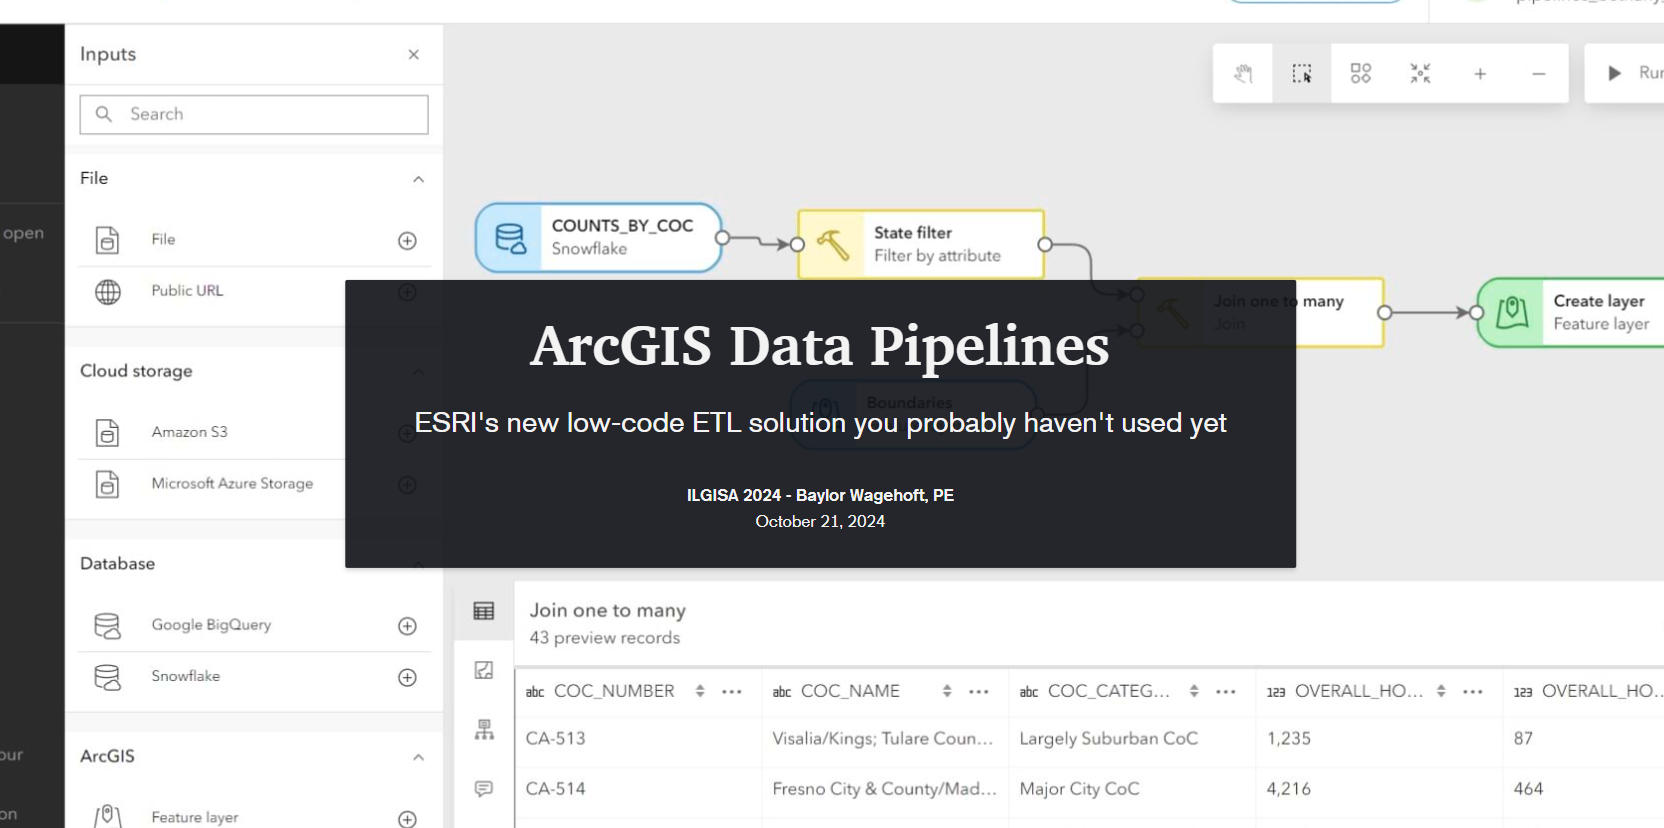
The conference presented a comprehensive slate of sessions, workshops, and panels aimed at advancing GIS practices, tools, and knowledge-sharing for professionals across sectors. As per the norm a significant theme was the usage of how er all use Esri software to address real-world challenges. Some of the most attended sessions were presented by Esri staff themselves, Nate and Anna did great. Some favorite sessions showcased automation and data management within Esri’s platform, covering tools like Microsoft Power Automate & Make.com to streamline repetitive tasks, saving time and reducing error. These sessions highlighted how GIS can enhance community engagement by making spatial data more accessible to the public. Several of our Illinois local government friends showed off very practical examples showed how others could automate data updates and integrate Esri software with enterprise databases using Arcade to keep geospatial information up-to-date across departments. Baylor and Micah both gave presentations on ArcGIS Data Pipelines and ArcGIS Earth respectively. Both were well received even though by Tuesday, Baylor had completely lost his voice. Glad that all the rooms were equipped with microphones.
Not to be one-sided, the open-source sessions underscored the importance of self-sufficiency and scalability in GIS, offering practical takeaways for using these tools to solve real problems. There were several great sessions showcasing FOSS4G-only enterprise GIS deployments. As more organizations turn to open-source GIS, it was great to see the ILGISA community fostering an environment for learning, collaboration, and exploration, empowering professionals with the skills and networks needed to effectively implement open-source solutions.

As an organization, I’m proud to say ILGISA is strong and financially responsible. It is great to see some statewide initiatives gaining traction like the low distortion county projections and even talk (not much else) of a statewide parcel fabric. Chad Sperry received the well deserved Hilton Distinguished Collaboration award and we even gave out the Dahlberg Acheivement award to Cindy Barbra-Brelle for her amazing work on the E911 project.
Of course, the social aspect of ILGISA can not be overstated. We enjoyed giving away some MSGS Swag and introducing Ethan and Katie to anyone we could in the Illinois GIS community. Big thanks to our friends from across the river for sponsoring a great social night at Uncle Bucks Bowling. In addition, networking events (just hanging out) facilitated connections between practitioners, enabling them to share their own implementations, discussing common challenges, and explore emerging geospatial technologies together. Through sessions and informal networking, ILGISA 2024 attendees left with valuable insights into how to enhance efficiency, improve data accuracy, and implement innovative solutions within our GIS Industry.

City, Village, or Town? Is there really a Difference?
When navigating the landscape of local government in Illinois, it's essential to understand the distinctions between villages, cities, and towns. While these terms may seem interchangeable, they refer to different forms of municipal governance, each with its own structure and rules.
Geospatial > The Layer File > City, Village or Town? Is there really a Difference?
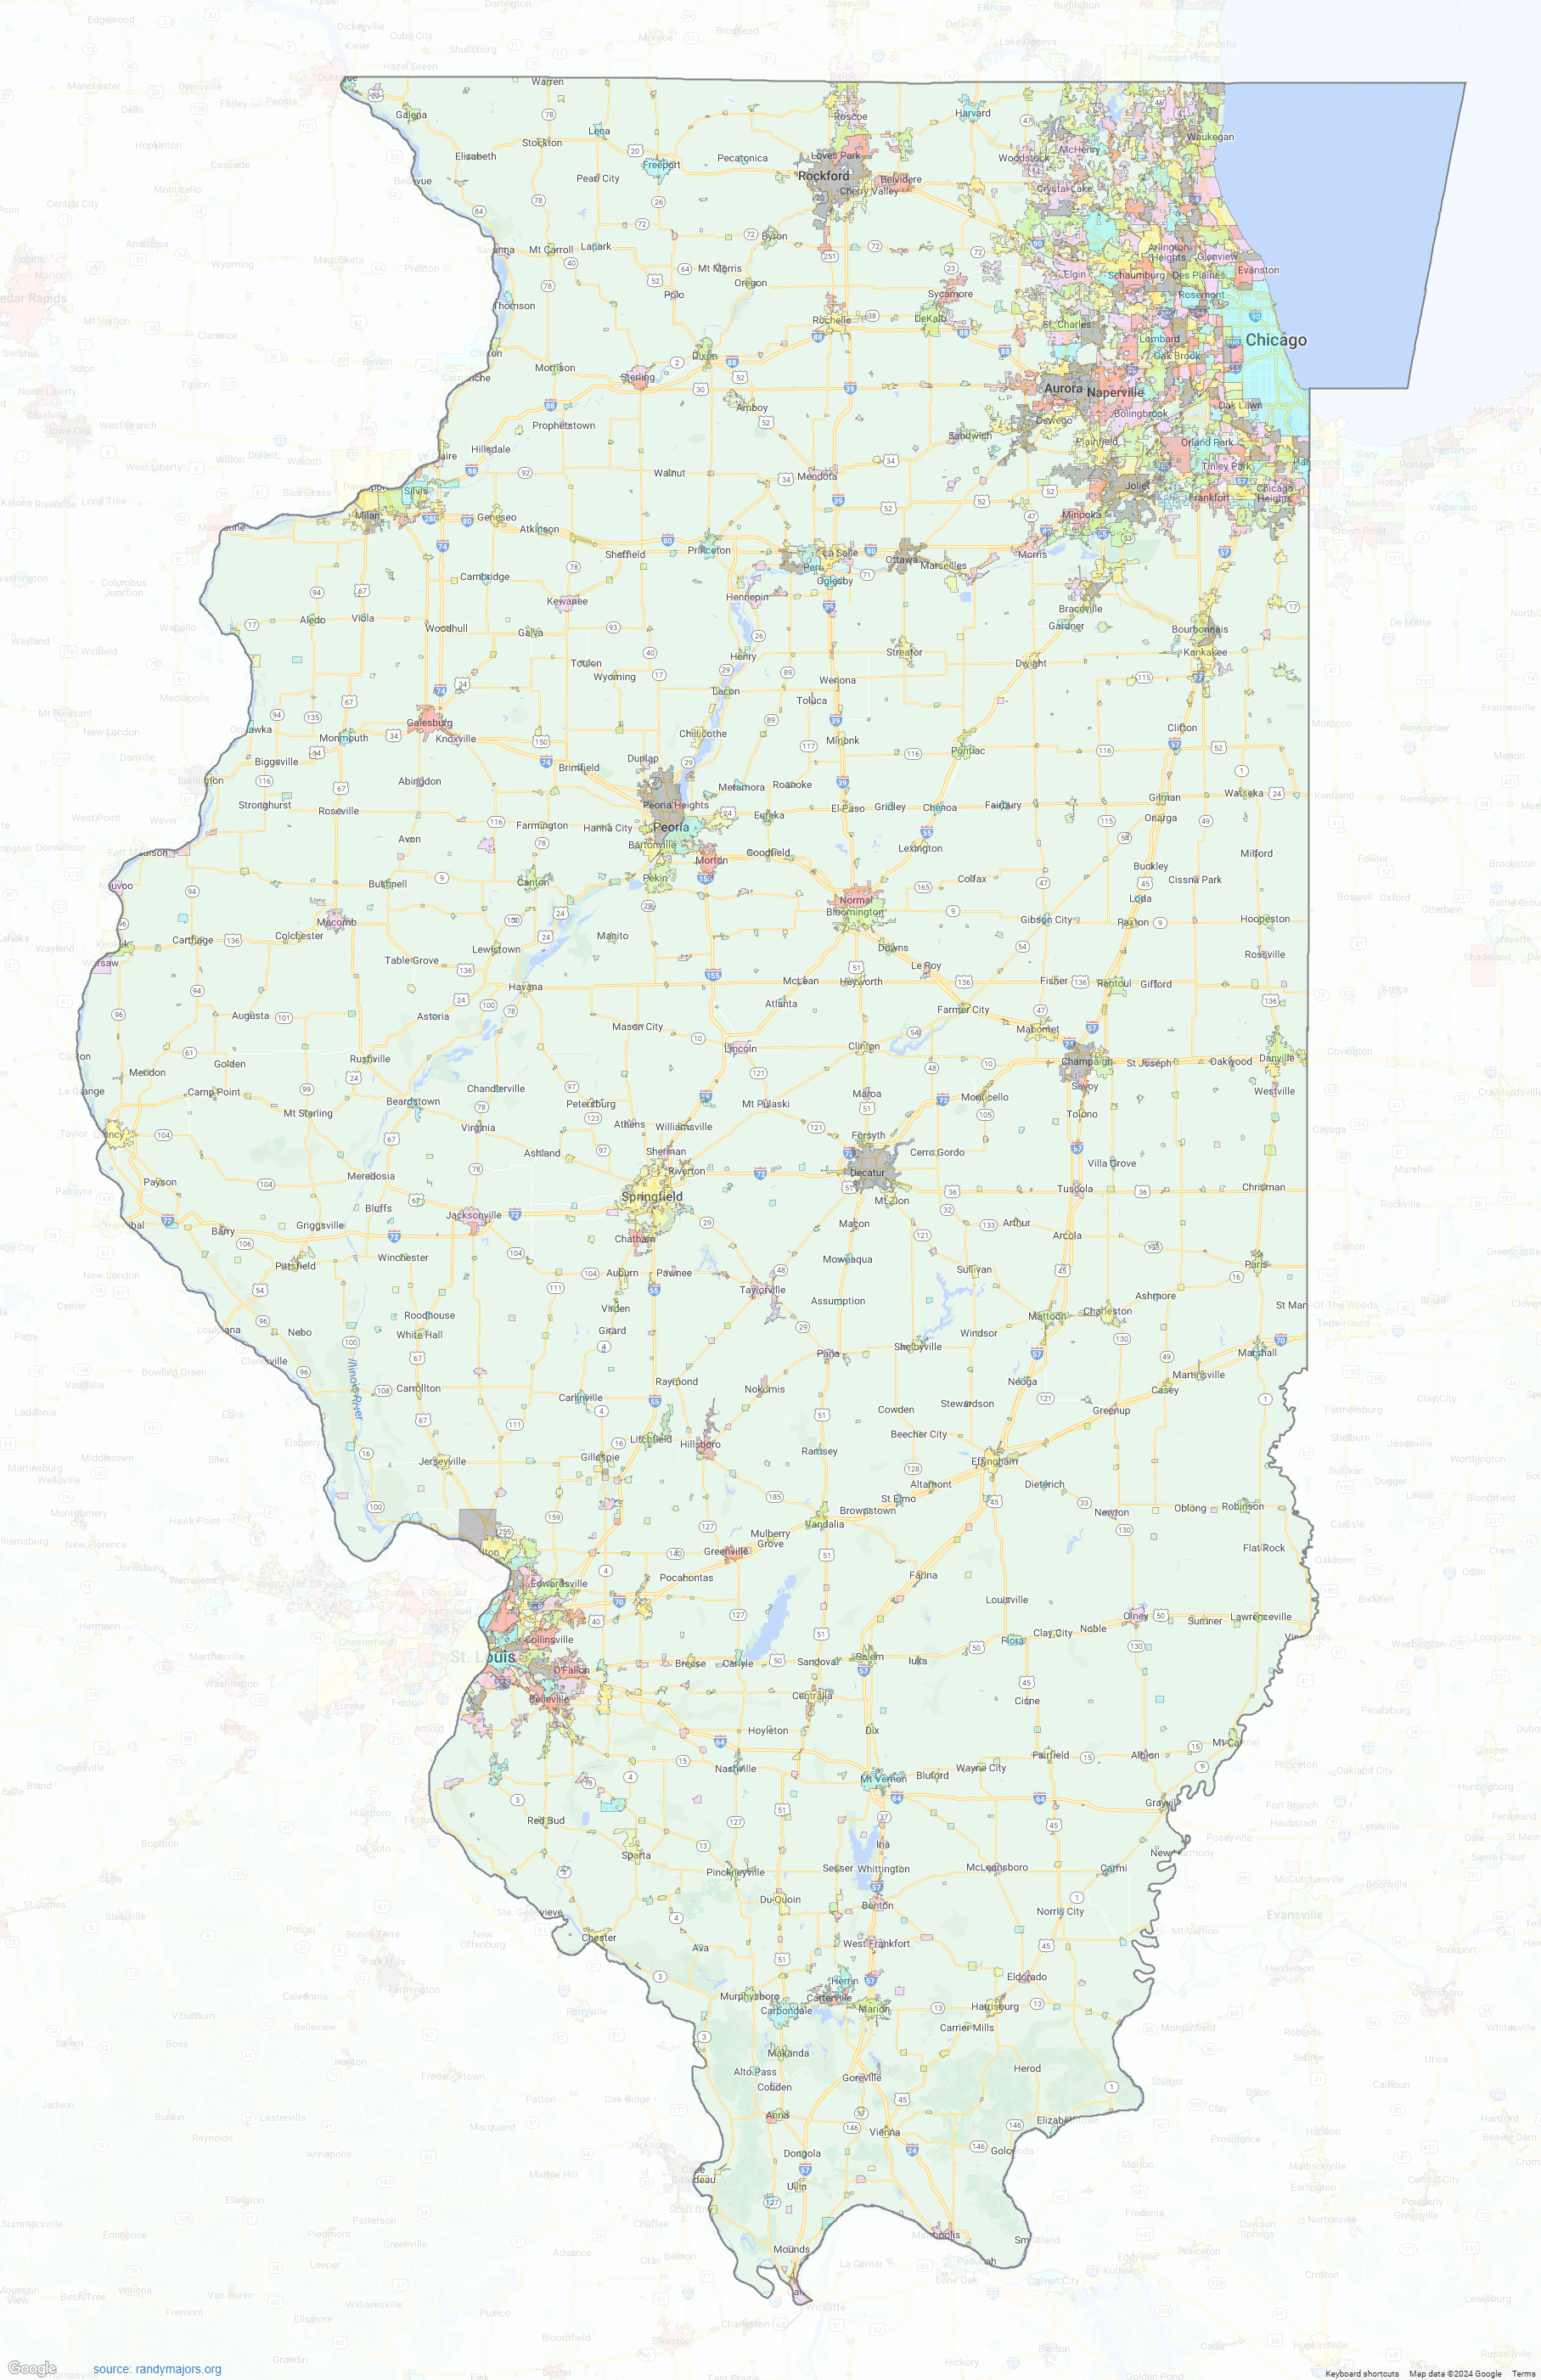
When navigating the landscape of local government in Illinois, it's essential to understand the distinctions between villages, cities, and towns. While these terms may seem interchangeable, they refer to different forms of municipal governance, each with its own structure and rules. So, what sets these three apart?
Villages vs. Cities
The primary difference between a village and a city in Illinois lies in their form of governance. Both villages and cities are types of municipal corporations, but they differ in their organization and powers.
Villages typically operate under a simpler governance model, often using a trustee-village form with a board of trustees and a village president (or mayor) to manage local affairs. This structure allows for a more hands-on, localized approach to governance, especially in smaller communities. Village boards make decisions on local ordinances, zoning, public safety, and services like water and sewer management, on the other hand, often have a more formal governance structure.
The aldermanic-city form is common, where alderpersons are elected to represent different wards, and the mayor acts as the chief executive officer. Cities generally offer a broader range of services and have the ability to levy taxes for more purposes compared to villages.
Larger cities may also adopt the strong mayor form, where the mayor has significant executive power, including the authority to appoint department heads without council approval. This system supports larger populations and more complex infrastructures .
Towns in Illinois
In contrast, towns in Illinois are more complex because the term “town” refers to a township in many cases, rather than a type of municipal government. Townships are a unique form of government in Illinois, focused primarily on rural and unincorporated areas. They manage services like road maintenance, property assessments, and social services for residents who live outside of municipal boundaries.
There are exceptions, such as Town of Normal, which functions similarly to cities in terms of governance and services but has retained "town" in its name for historical reasons. However, this is simply a stylistic choice, as the town functions similarly to cities in terms of governance and services.
Variations
Variations in municipal government can go beyond the basic distinctions between villages and cities, Illinois municipalities can also adopt more specific forms of governance:

Commission Form: This form, limited to municipalities with populations under 200,000, allows voters to elect a mayor and four commissioners. Each commissioner has executive control over specific administrative departments, such as public safety or public improvements .
Managerial Form: Available to municipalities with populations under 500,000, this form retains the legislative powers of the council or board while a professional municipal manager handles administrative and executive duties. The manager can appoint and remove department heads and oversee day-to-day operations .
Strong Mayor Form: In larger municipalities, this form grants the mayor significant executive power, including the ability to appoint and remove department heads without the city council's advice and consent. This is typically adopted in larger cities where executive oversight is critical .
Choosing Between Them
When communities decide whether to incorporate as a village, city, or remain part of a township, the choice often comes down to population size, infrastructure needs, and preferences for governance. Villages work well for smaller, tight-knit communities, while cities are better equipped to handle the complexities of larger populations. Townships, meanwhile, offer governance over broader, often rural areas, where municipal services are less in demand.
Understanding these distinctions is crucial for residents and businesses alike as they navigate local governance in Illinois. Each form offers unique advantages, tailored to the needs of the community, with varying levels of autonomy, services, and governance structures
Sources:
Illinois Municipal League (IML) - Forms of municipal government in Illinois.
Illinois Municipal Code - Governance and Powers of Cities.
Chicago Tribune - Strong Mayor Systems in Large Illinois Cities.
Township Officials of Illinois (TOI) - Understanding Township Government.
Town of Normal, Illinois - Municipal Governance Overview.
Illinois Municipal League (IML) - Commission Form of Government.
Illinois Municipal Code - Managerial Form and Role of City Managers.
Illinois Municipal League (IML) - Strong Mayor Form of Government.
Illinois State Board of Elections - Incorporation and Governance Choices in Illinois.
https://mapgeeks.org/illinois/
These sources help clarify the legal and functional distinctions between cities, villages, and townships in Illinois.
Ethan Geisler Joins Our Geospatial Team
We are thrilled to welcome Ethan Geisler to the Maurer-Stutz Geospatial Services (MSGS) team. Ethan joins us as a Geospatial Specialist with a fresh degree in Geography from Illinois State University, and he's eager to hit the ground running. With a background in GIS software like ArcGIS Pro and ArcGIS Online, Ethan brings a well-rounded skill set.
Geospatial > The Layer File > Ethan Geisler Joins Our Geospatial Team
We are thrilled to welcome Ethan Geisler to the Maurer-Stutz Geospatial Services (MSGS) team!

Ethan joins us as a Geospatial Specialist with a fresh degree in Geography from Illinois State University, and he's eager to hit the ground running. With a background in GIS software like ArcGIS Pro and ArcGIS Online, Ethan brings a well-rounded skill set, honed during his internship with FEMA where he developed a Tornado Awareness dashboard application. This real-world experience will help him seamlessly integrate into our projects, which often involve critical data and mapping needs.
What sets Ethan apart is his passion for using GIS to solve real-world challenges, a trait he demonstrated in his final project at ISU, where he worked on a pedestrian safety study using Survey123. Outside of work, Ethan’s organizational leadership skills shine as the former President of ISU's Music Business Organization, where he organized events and led a team of fellow students—skills that will serve him well as he collaborates with our team on diverse geospatial projects. He also plays drums and is deeply invested in the Game of Thrones franchise.
Ethan will be working closely with our team to support infrastructure mapping, perform spatial analysis, and contribute to the development of tailored GIS solutions for our clients. We’re excited to see his fresh perspective and strong attention to detail make an impact as we continue to grow our geospatial services.
Welcome aboard, Ethan!
It's Conference Season Already! (PART 2)
It’s September, which means the fall conference season is here. While our young team is still deciding which organizations to support and be a part of, there are a few that are a no brainer: ILGISA, IACE, EPN just to name three. Last week, Baylor and I both visited separate conferences to see if they would be good conferences to attend or even exhibit at in future years.
Geospatial > The Layer File > It's Conference Season Already! (PART 2)
it’s September.
Which means the fall conference season is here. While our young team is still deciding which organizations to support and be a part of, there are a few that are a no brainer: ILGISA, IACE, EPN just to name three. Last week, Baylor and I both visited separate conferences to see if they would be good conferences to attend or even exhibit at in future years. Below is Baylor’s Summary of GEOGRAPH and Micah’s summary of FOSS4G NA was earlier this week.
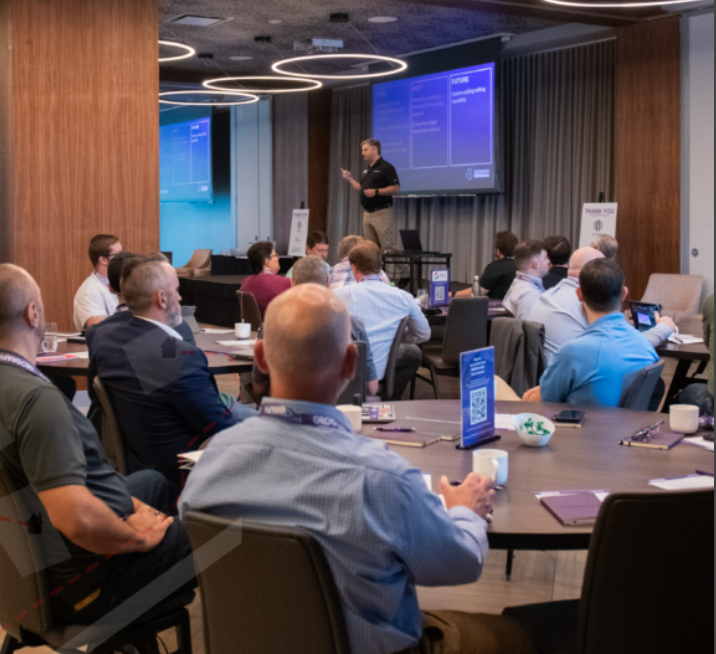
Maurer-Stutz Geospatial Services Attends the 2024 GEOGRAPH User Conference: A New Chapter in Fiber Network Management
Maurer-Stutz Geospatial Services (MSGS) had the privilege of attending the 2024 GEOGRAPH User Conference in Greenville, SC from September 9-11. This year’s event brought together industry leaders, software developers, and telecommunications experts, providing us with invaluable insights into the latest advancements in fiber network management, broadband mapping, and digital infrastructure planning.
The conference, hosted by GEOGRAPH Technologies, gave us the opportunity to further explore CrescentLink, the powerful fiber network management solution that we’ve been integrating into our geospatial services. Through this collaboration with GEOGRAPH, MSGS is excited to expand our fiber solution offerings, reinforcing our commitment to delivering comprehensive, cutting-edge GIS support for fiber providers.
Highlights from the Event:
GEOGRAPH’s Vision for the Future: CEO Bruce Smith shared an exciting update on GEOGRAPH's growth and future innovations during the opening keynote. With new developments on the horizon for CrescentLink, we look forward to continuing our partnership, enhancing our service offerings to ensure our clients can take full advantage of the CrescentLink platform.
Broadband Mapping and Digital Divide Solutions: One of the most impactful sessions featured Jim Stritzinger, the South Carolina Broadband Director, who shared how their state is leading the way in broadband mapping and BEAD fund management to bridge the digital divide. This insight fuels our passion for working with underserved fiber providers, ensuring communities across Illinois and beyond benefit from the same cutting-edge fiber management tools.
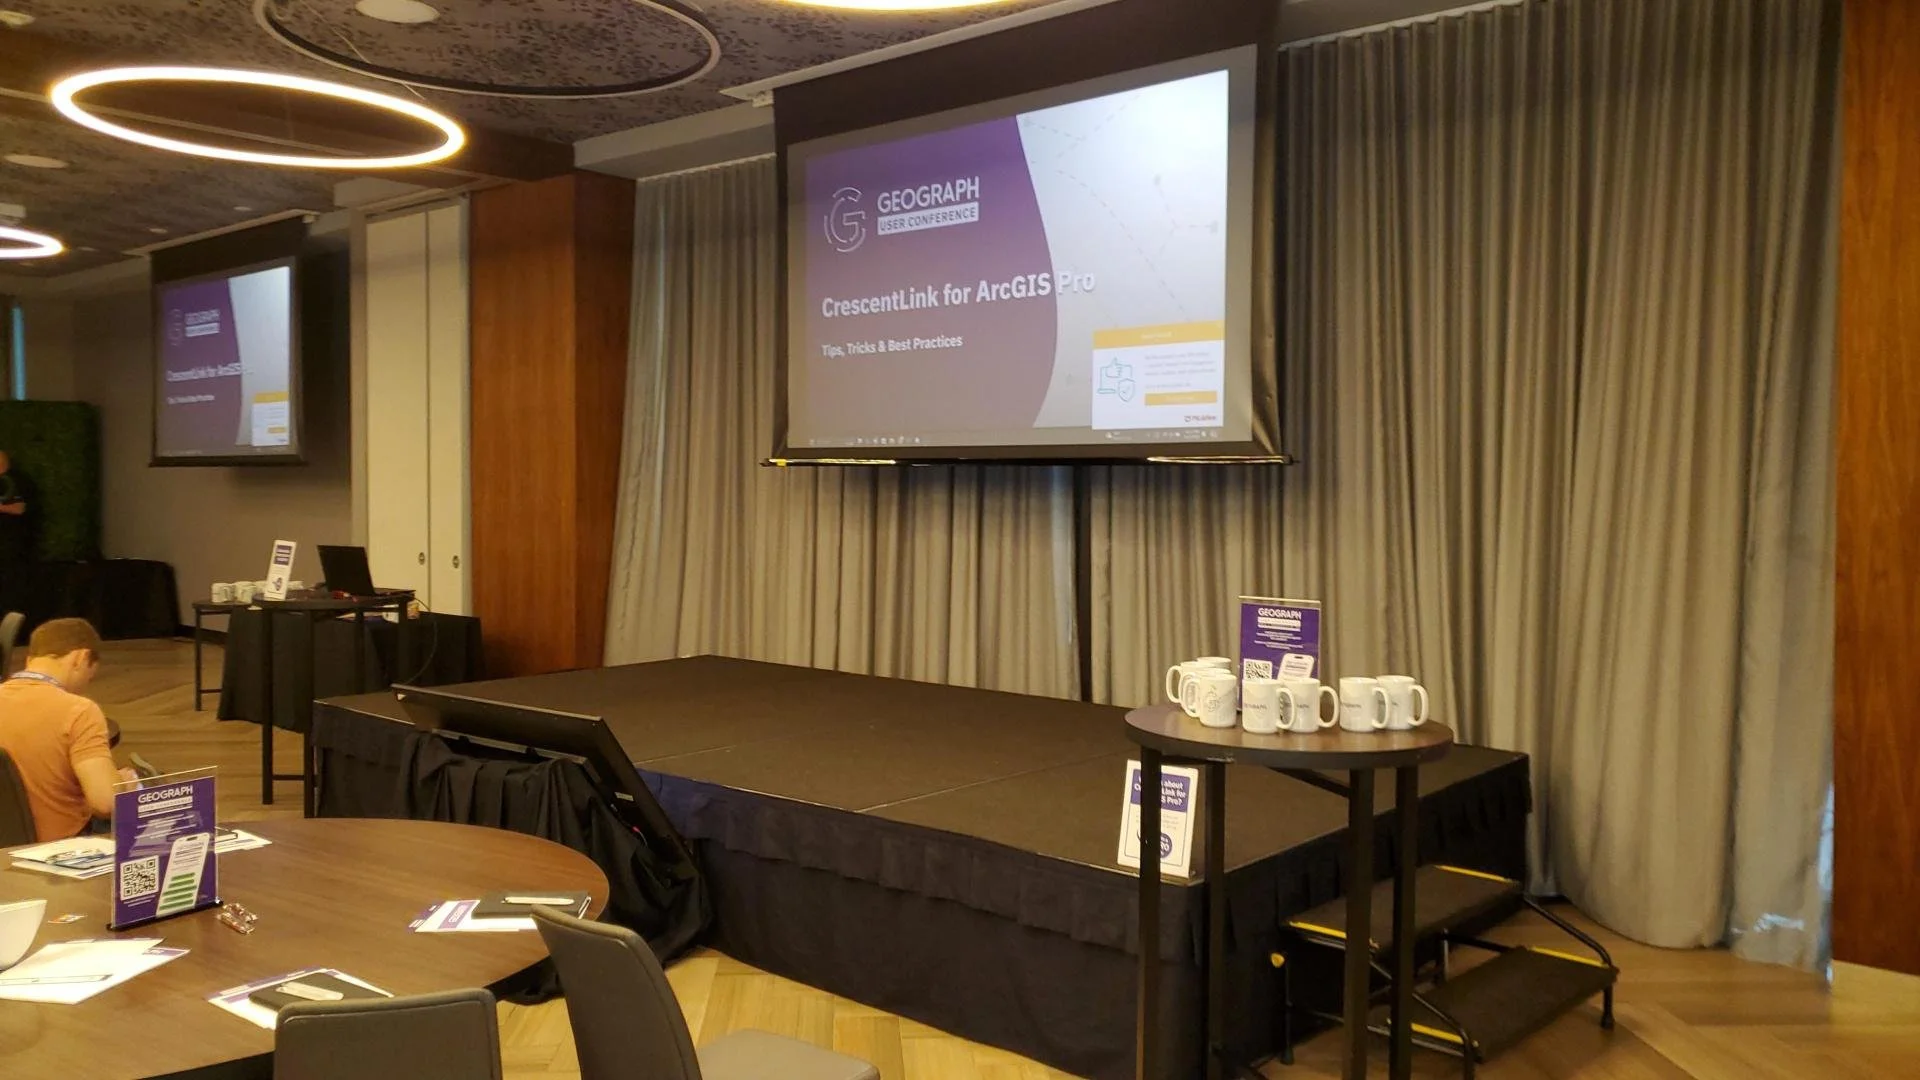
CrescentLink for ArcGIS Pro: With CrescentLink’s move from desktop to ArcGIS Pro, MSGS is eager to help our clients transition smoothly. Sessions led by Grey Pittman and DJ Henrique offered best practices and valuable tips on how to fully leverage CrescentLink within ArcGIS Pro. With MSGS’s expertise in enterprise GIS, we are well-positioned to support our clients in making this shift and maximizing the benefits of this next-generation software.
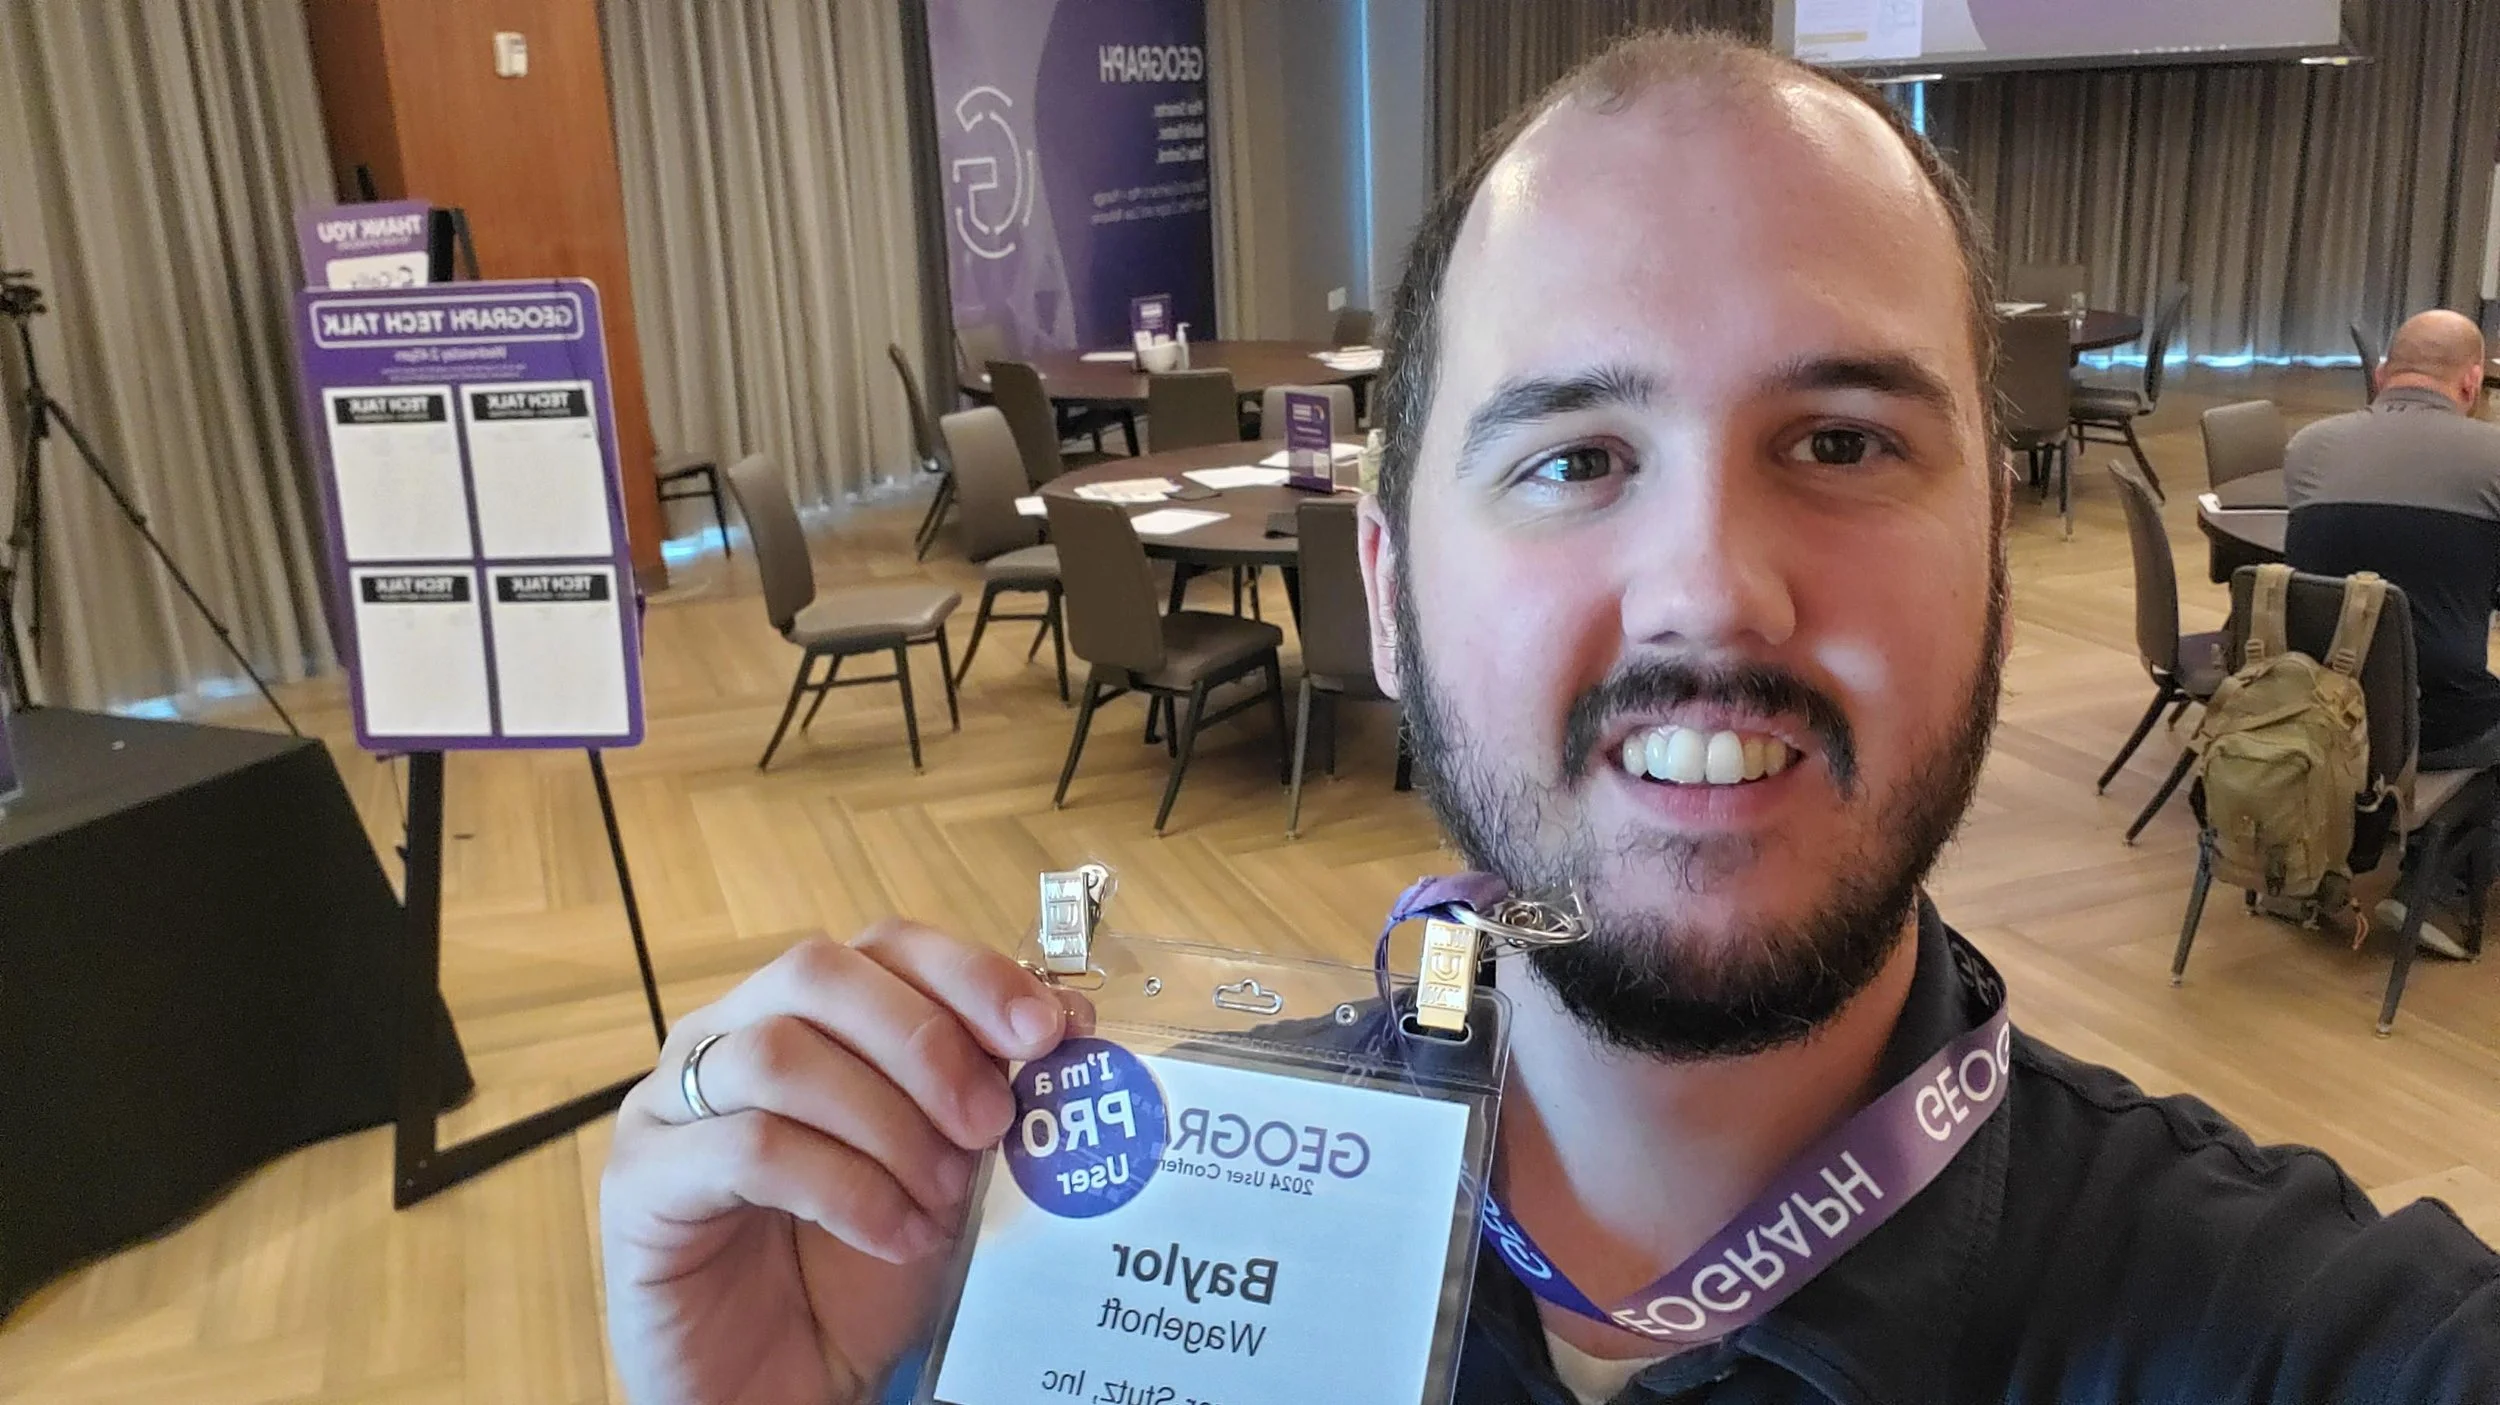
Engaging One-on-One with GEOGRAPH Experts: A unique feature of this year’s conference was the GEOGRAPH Tech Talk, where we had the opportunity to engage in in-depth, one-on-one conversations with the CrescentLink development team. Our team was able to discuss current and future needs for our clients, planning how we can continue to innovate and provide exceptional geospatial services in fiber network management.
Looking Ahead:
At MSGS, our focus has always been on providing specialized geospatial solutions that turn our clients’ visions into reality. Partnering with GEOGRAPH Technologies allows us to expand our offerings to include enhanced fiber network deployment, conversion, and ongoing management services—ensuring our clients can optimize their fiber networks from the ground up.
The 2024 GEOGRAPH User Conference affirmed that fiber networks are the digital backbone of tomorrow’s infrastructure. By combining MSGS’s deep expertise in GIS with CrescentLink’s powerful tools, we’re setting a new standard for fiber management, particularly for small and mid-sized providers who may lack access to these advanced solutions.
As we look ahead, we’re excited to continue working closely with GEOGRAPH, offering a seamless experience for our clients in deploying and managing fiber networks. This collaboration allows us to deliver tailored, scalable solutions, empowering providers to expand their network capabilities, enhance customer satisfaction, and ultimately stay ahead in the rapidly evolving telecommunications industry.
For more information on how MSGS and CrescentLink can transform your fiber network management, visit our website or schedule a call with one of our experts today.
It's Conference Season Already! (PART 1)
It’s September, which means the fall conference season is here. While our young team is still deciding which organizations to support and be a part of, there are a few that are a no brainer: ILGISA, IACE, EPN just to name three. Last week, Baylor and I both visited separate conferences to see if they would be good conferences to attend or even exhibit at in future years.
Geospatial > The Layer File > It's Conference Season Already! (PART 1)
it’s September.
Which means the fall conference season is here. While our young team is still deciding which organizations to support and be a part of, there are a few that are a no brainer: ILGISA, IACE, EPN just to name three. Last week, Baylor and I both visited separate conferences to see if they would be good conferences to attend or even exhibit at in future years. Below is Micah’s summary of FOSS4G NA. Baylor’s Summary of GEOGRAPH will be next.
FOSS4G North America
The 2024 Free and Open Source Software for Geospatial (FOSS4G) North America conference took place in St. Louis, Missouri, from September 9-11. It attracted a wide variety of geospatial professionals, developers, and enthusiasts to collaborate and explore the transformative potential of open-source geospatial technologies. A key focus of the conference was on democratizing access to geospatial tools, emphasizing how open-source solutions can empower individuals, small businesses, and organizations.
I (Micah) actually did my Master’s thesis on FOSS4G software in the Enterprise GIS realm. So, even with spending 90% of my career in Esri software, I have a working knowledge of the players and platforms. Additionally, the STL is too close not to attend such a notable and relevant conference. Aside from the agenda looking great, I wanted to meet a few of the people I saw chatting about the conference online. Unfortunately, due to scheduling issues and family commitments, I could only attend on Wednesday. Still, I wanted to know where FOSS4G as an industry is compared to the proprietary behemoth with whom we are admittedly a part of their partnership network.


Sessions
The sessions I leaned towards spoke of web mapping, data, and enterprise systems. I learned that there is a working community group at the the World Wide Web Consortium (W3C) to develop standards and guidelines for creating a new standardized and easy map HTML element for display in modern browsers. The demonstration of MapML showed tiling, full screen, as well as pop-ups interacting with the OGC services from GeoServer via custom CSS. Noting stated about other protocols.
What I did learn about Parquet and GeoParquet is that I should be using it. Not so much Crunchy Bridge analytics, I don’t have that much data and it’s too onerous to port what I do have.
Although, the Overture Map Foundation is of interest, I’m skeptical. My very distilled explanation is that it starts with Open Street Map data, enhances with TomTom data and a dash of Foursquare into it, and provides it to whoever wants to download. I do want to critically look at the data for the small towns that are our clients. Also, this may be a great place to start to learn GeoParquet seeing that is how they deliver the data. Regardless of the quality of data, it was a fantastic presentation by Steven Pousty.
After lunch, and learning that Mapillary is actually owned by Meta now (Hello 2020), I heard the best quote from the developer of startup GeoBlaze during a live demo on Hotel WiFi: “It’s so fast, you think it’s not working”, neat tool, don’t know what it’s for. I tried to learn how to scrape geodata, but was quickly lost in the technical details.
The final presentation I went to was to see the evolution of GeoMoose 4. This fast, lightweight web viewer now works serverless. Dan Little showed the snazzy demo published from a public Google Drive folder. The application has quite the modern ‘feel’ and read geo layers right from within the folder.
Thoughts
Here’s a Hot Take: Linux and other FOSS may run the world during apocalypse, but that's not now.I believe in the idealism and the core principles of Free and Open Source Software, but I don’t think they’re practical in real life (Insert your token statistic here of what already runs on FOSS). Believe me, as a card-carrying GenXer, I LOVE the idea of going against the grain. I push back whenever I can, I listen to STP on 11, I don’t match my socks, and drive an old jeep because I choose to, don’t you dare tell me what to do. That mentality is all well and good when you are your own boss or there is a principled leadership decision to use FOSS. As a consultant using someone else’s money to build a business that plays nicely with a local governments' GIS and a DOT’s project requirements, I need to use the proprietary software that they are or tell us to.
Here's a hard truth, using FOSS, and specifically FOSS4G, is not easy. I still don’t see a complete out-of-the-box FOSS enterprise GIS solution that can compete with ArcGIS Enterprise. This discrepancy is especially accentuated when 99% of your clients use Esri. Do not misunderstand, sometimes Esri is the bane of my existence. I can rant and rail with the best of the trolls, but this is business. I need to prove my excellence in the board room and on proposals in the most efficient way possible. Everyone loves to hate on success while they quietly try and copy it.
I will continue to keep an eye on FOSS4G. I promise to keep my version of QGIS updated. I will not roll my eyes at open-source projects. I will continue to push for open standards and data. I also appreciate the community built around FOSS4G. Everyone loves an underdog.

A Map, a Move, and a Mission
A map, a move, and a mission: MSGS Geospatial Engineer, Baylor Wagehoft, comments on the City of Chattanooga Tennessee and gives his thoughts on a historic, visionary map for the City's Park System.
Geospatial > The Layer File > A Map, A Move, and A Mission
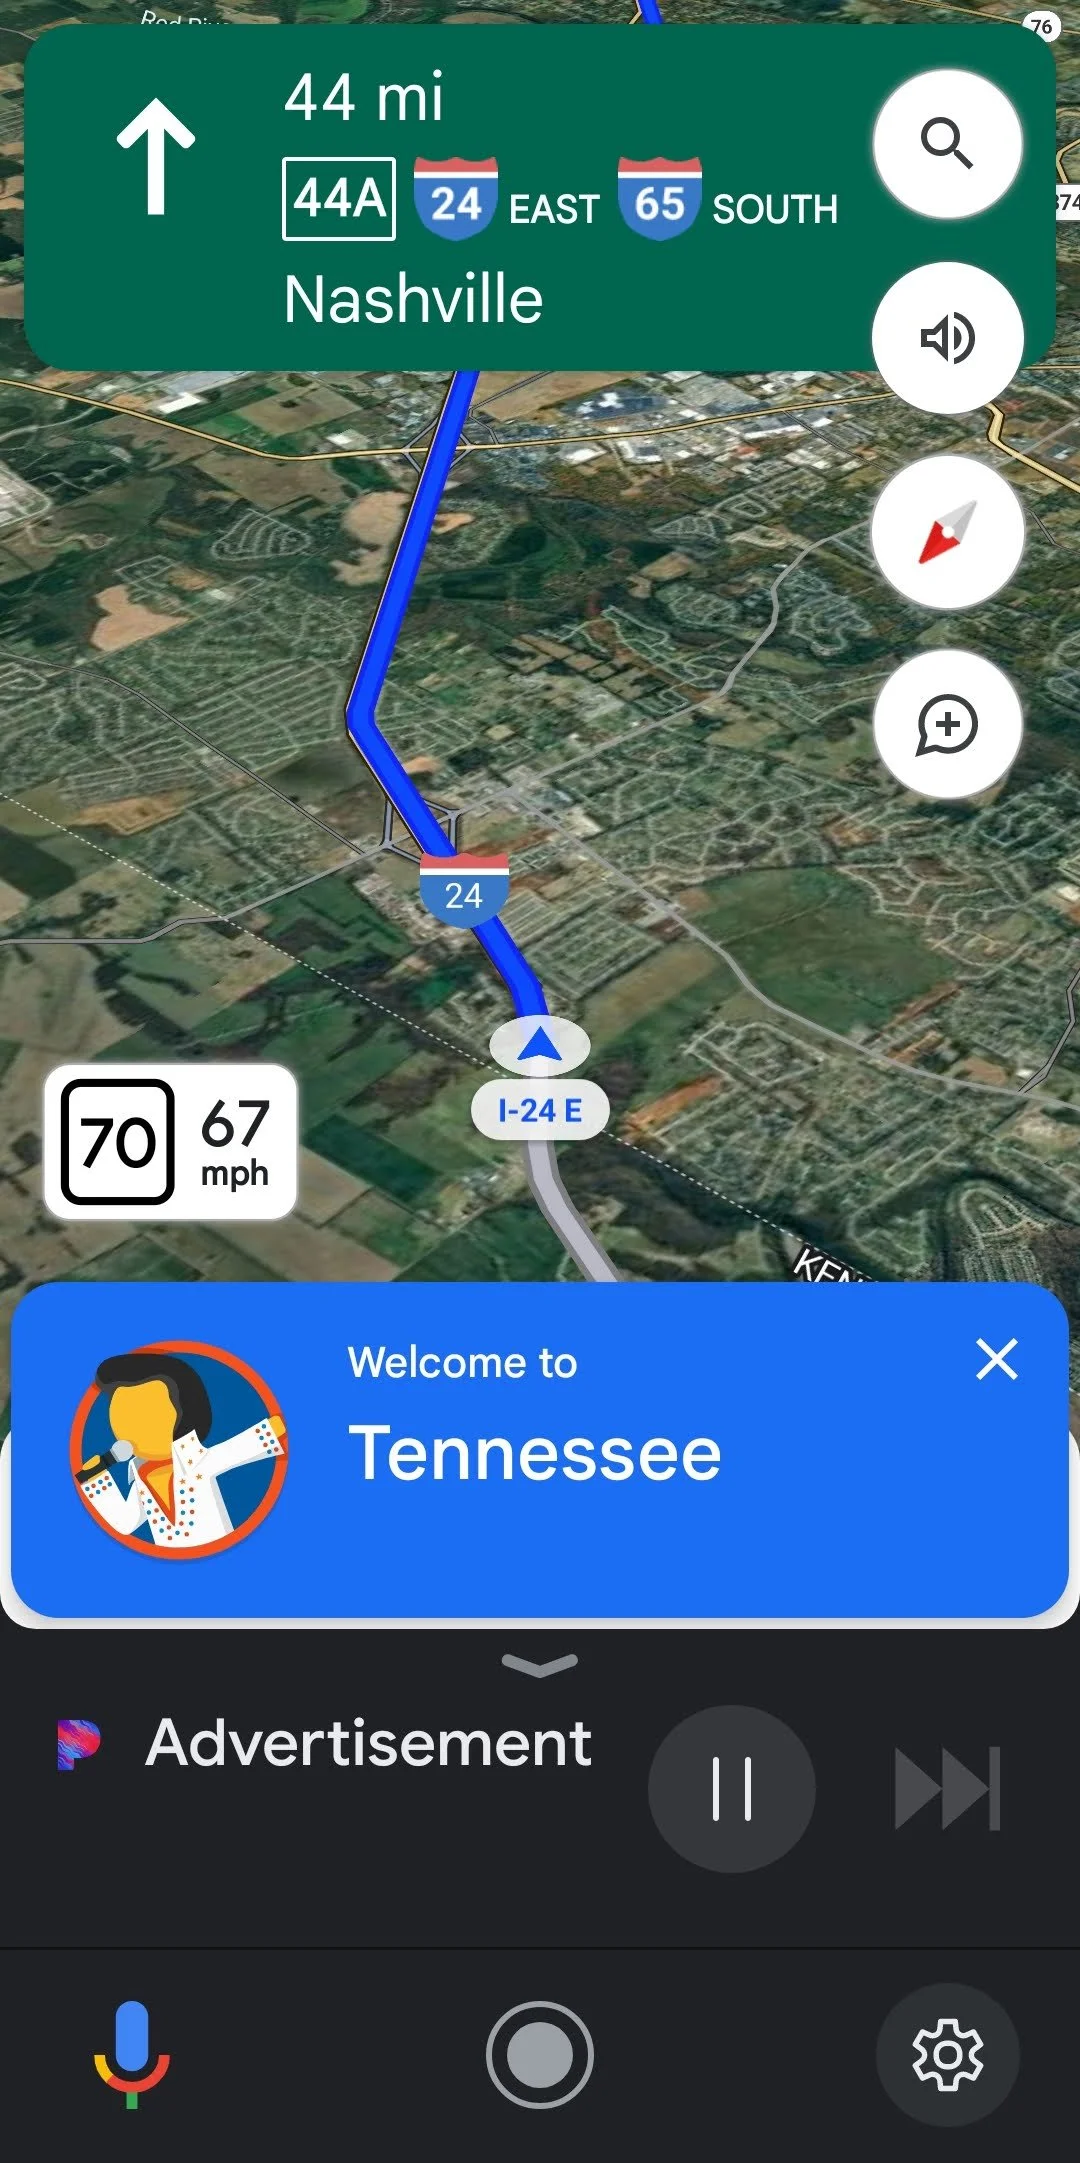
During an evening newscast in 1969, Walter Cronkite coined Chattanooga, Tennessee, as the “Dirtiest City in America”. This moniker was probably not that far from the truth, as the City’s historic Iron Foundries (dating back to the Civil War) and industrial sites polluted to air and water. However, since then, the City has completely shed that title. It is consistently ranked as the best place to live in Tennessee and named the “Best Town Ever” by Outdoor Magazine. It’s a hub for insurance giants (BCBS and UNUM), startups (specifically Quantum computing research), electric vehicle manufacturing (Volkswagen North America), and a thriving logistics network along a major interstate junction (I-75 & I-24).
Recently, the City embarked on an ambitious plan to become a National Park City. As part of this initiative, Charlie Hale (GIS Director at the University of Tennessee Chattanooga), was asked to develop an inspiring map that would chart a “vision” for Chattanooga’s Park System. This article is definitely worth a read itself (that map went on to be a winner at the 2023 ESRI UC map contest), but one of the things I found most interesting was actually the 1911 John Nolen Map.
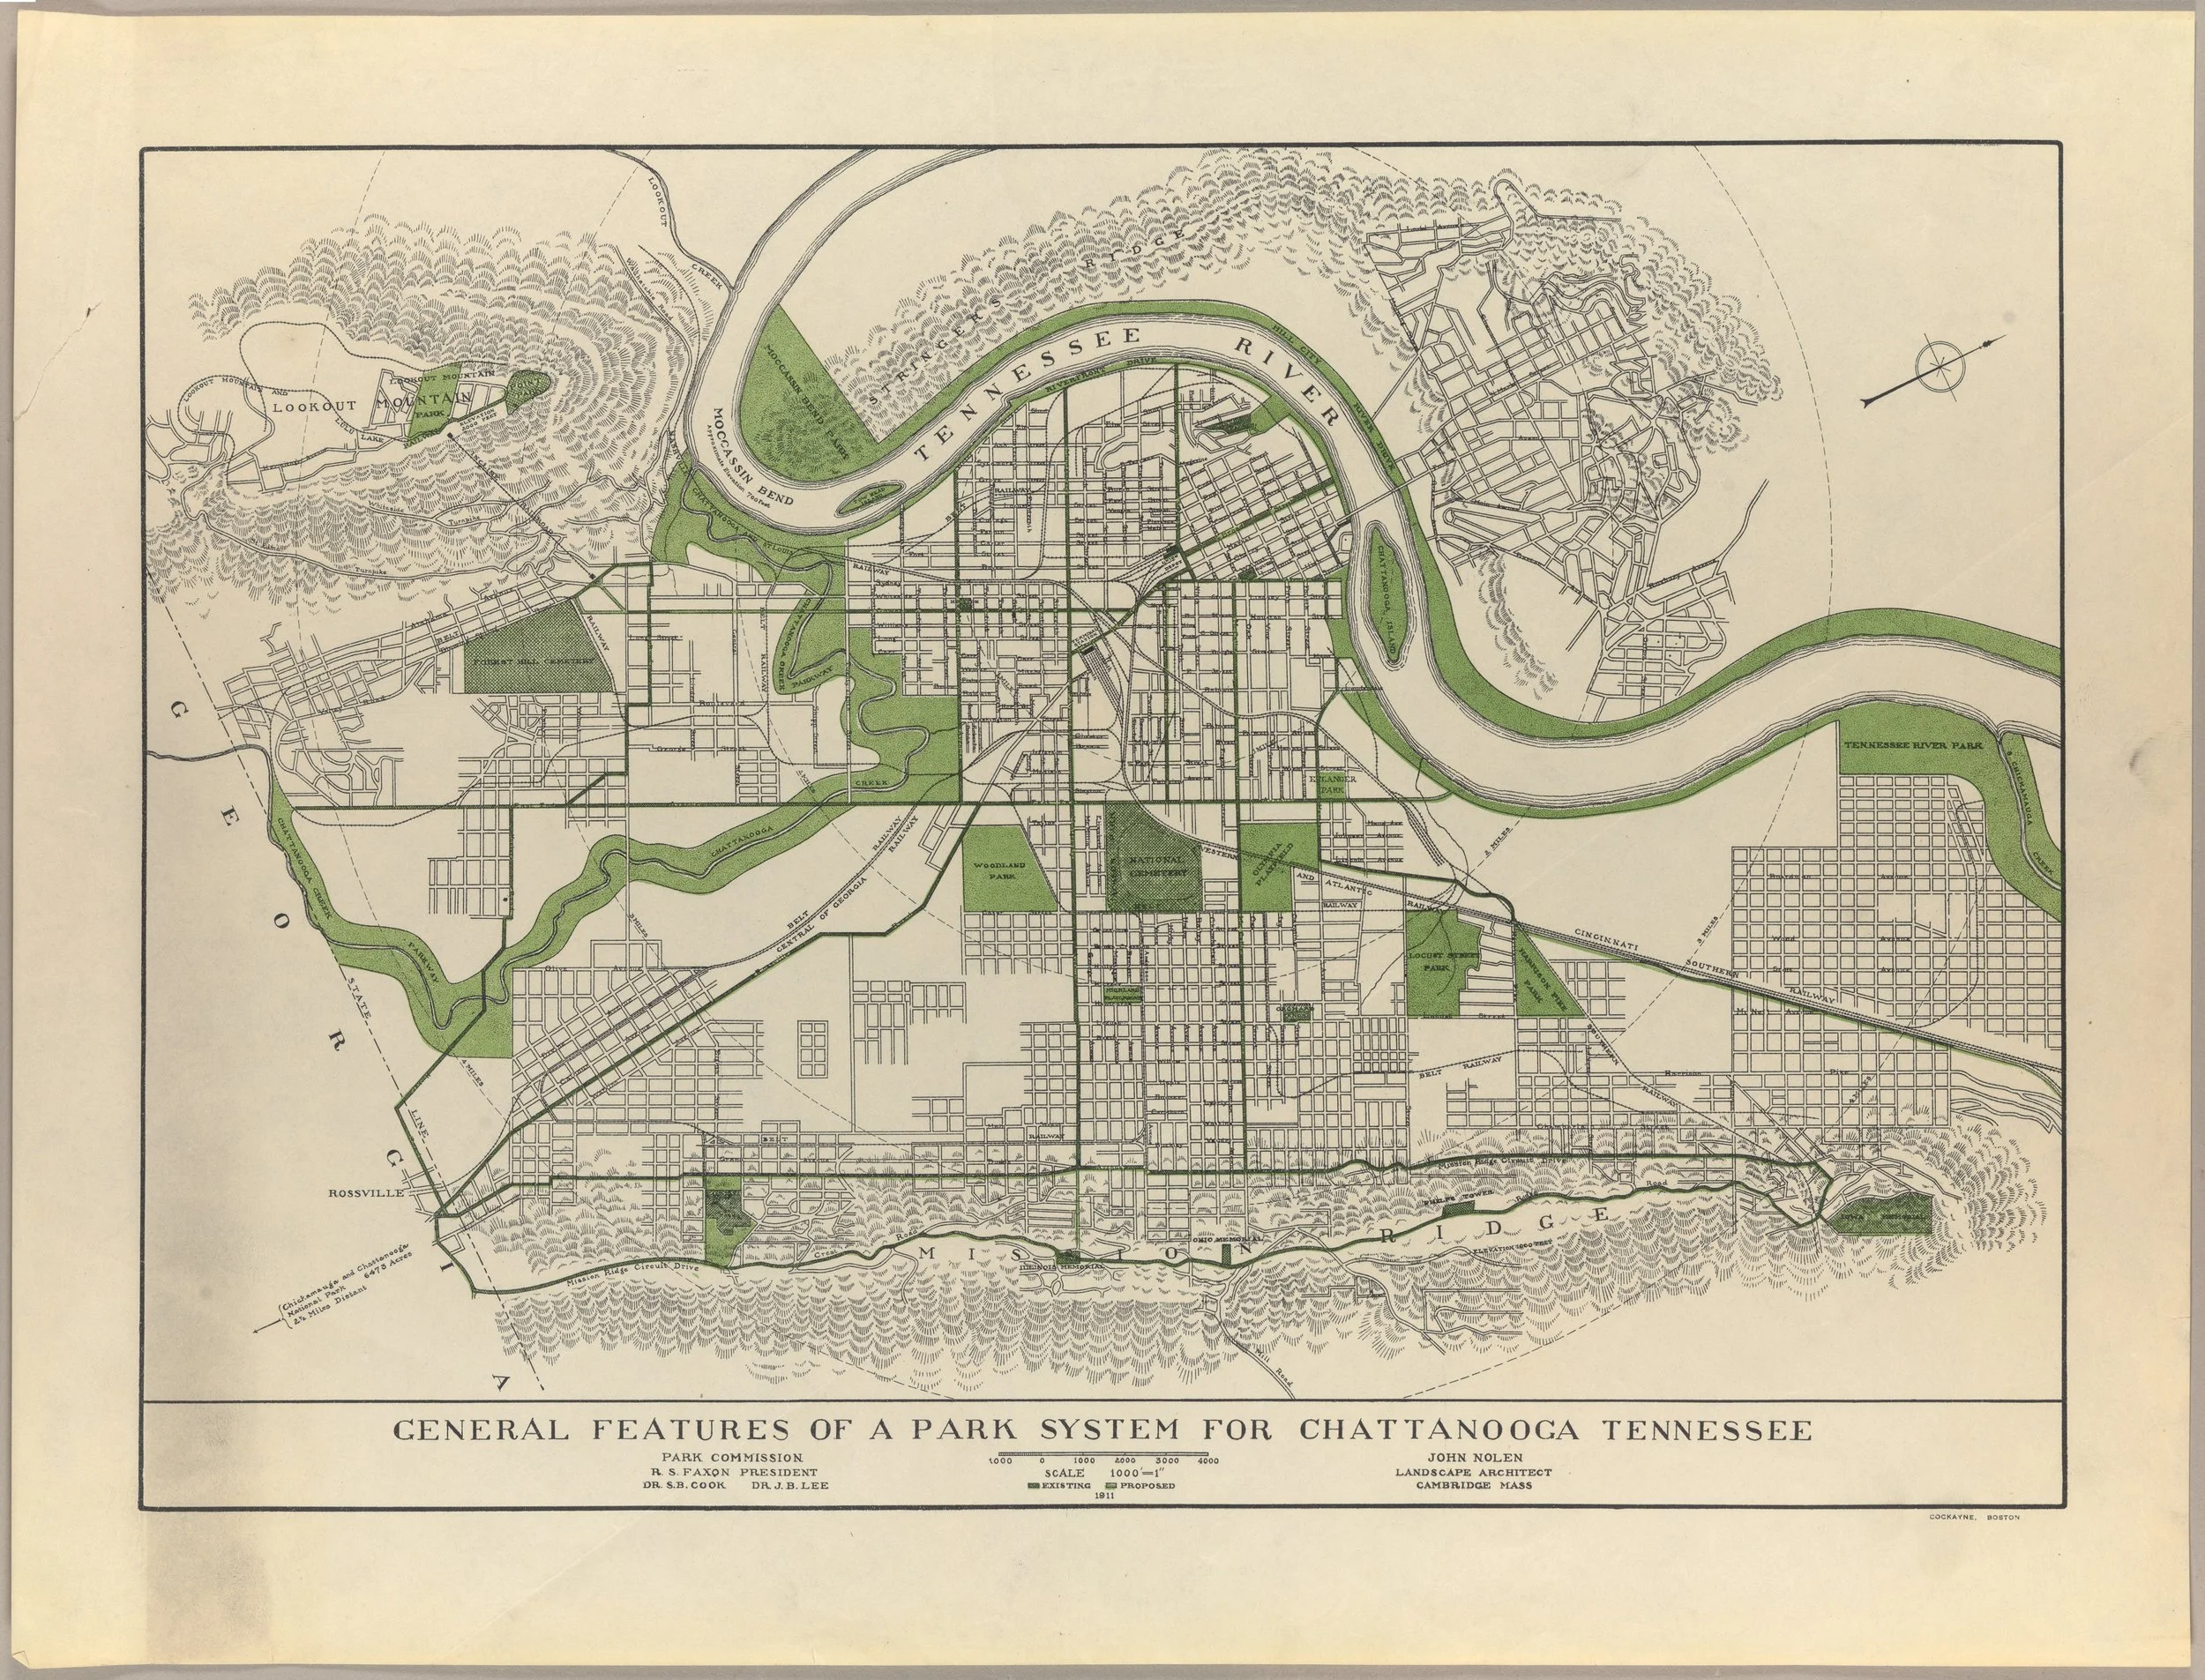
Credit: John Nolen Papers, #2903. Division of Rare and Manuscript Collections, Cornell University Library.
I think what I love about this map most is how simply it calls the viewer to a vision. There are only two colors: Black cadastral lines and Green for Parks/Greenways. Readers are immediately drawn to the most prominent geologic features of the area (Tennessee River, Lookout/Signal Mountain, and Missionary Ridge) and how the park system can work with them. Upon closer inspection, the designer has connected the larger park areas with Greenways along existing major thoroughfares - a call to the current day Complete Streets movement. Small details – like the map being rotated to the street grid and the hilly, forested areas hatched – enhance the map’s purpose and vision.
This map does one thing really well – it sets a vision for a thriving park system in a town plagued (at the time) by industrial waste and smog. I can put myself in the eyes of a resident and say “yeah, I can get behind this vision”. It may have taken over 100 years (and maybe a few decades more to fully “realize”) but I’d call its mission a success.
If you haven’t guessed already, I love talking about (okay, more like fawning over) the city of Chattanooga, Tennessee. My family and I love this area of the Country and the sense of place that is present here. It’s always been our dream to make the “big move” and raise our family here. Well, that dream officially became a reality 2 weeks ago. Thankfully, the move went very smooth and the only “casualty” was a broke salt-shaker!
Although the move may be a bit bittersweet in some ways (missing those impromptu office chats with the great team at Maurer-Stutz), we see this is a great opportunity to expand the mission and vision of Maurer-Stutz Geospatial Services to clients throughout the Tennessee and the Southeast. I recently attended the GEOGRAPH User Conference in Greenville, South Carolina. Be on the lookout for that blog soon!
The Southeast is booming, and MSGS will be there to help communities, businesses, and stakeholders meet their geospatial needs.

Advanced GIS Leadership
Last week, I had the opportunity to attend the URISA Advanced GIS Leadership Academy in Chicago, and it was a game-changer for how I approach both leadership and GIS. This intensive program brought together GIS professionals from across the country, each of us had unique challenges and insights, but all sharing some common experiences and struggles. It was a bit of therapy really. Among the many sessions, the ones on Value Stream Mapping and Personal Kanban really stood out to me.
Geospatial > The Layer File > Advanced GIS Leadership
Last week, I had the opportunity to attend the URISA Advanced GIS Leadership Academy in Chicago, and it was a game-changer for how I approach both leadership and GIS. This intensive program brought together GIS professionals from across the country, each of us had unique challenges and insights, but all sharing some common experiences and struggles. It was a bit of therapy really. Among the many sessions, the ones on Value Stream Mapping and Personal Kanban really stood out to me.
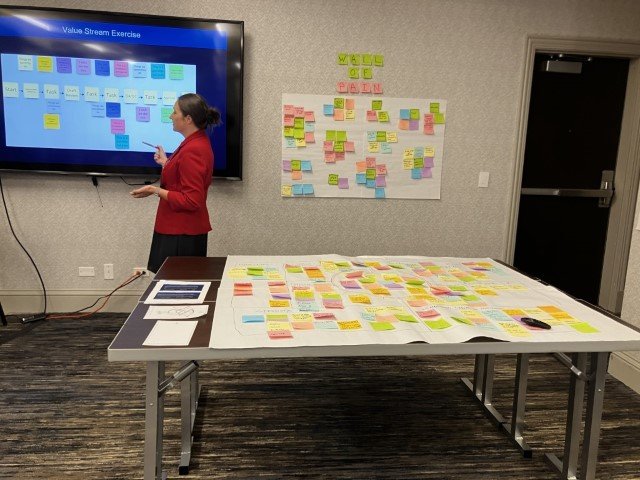

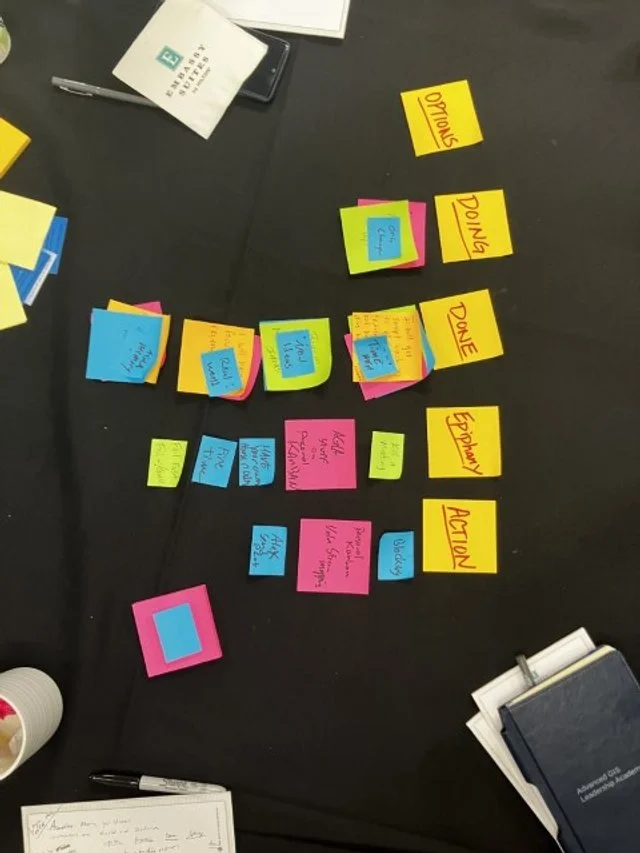
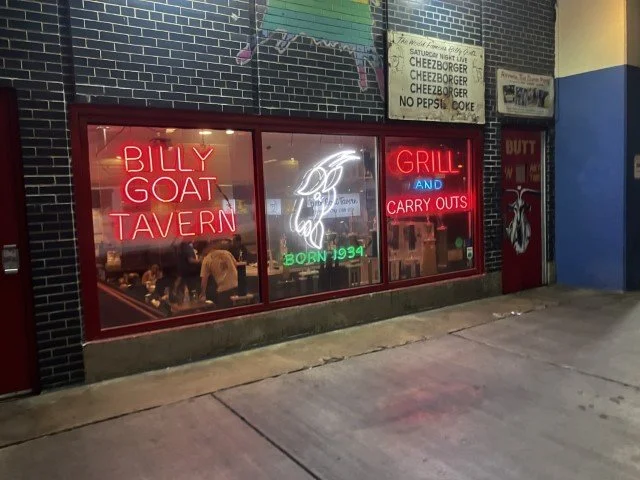

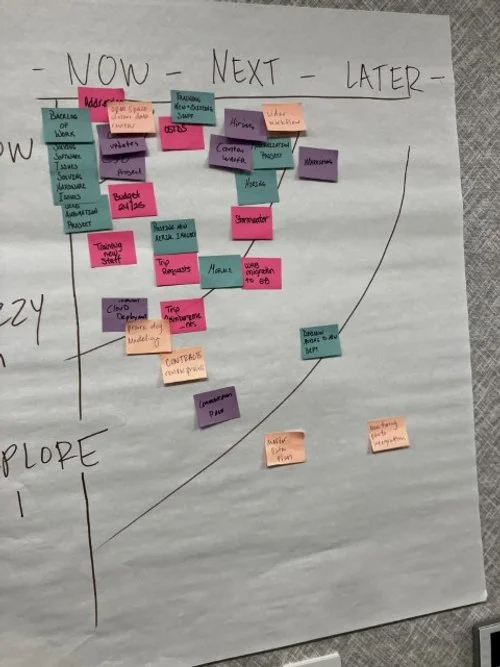
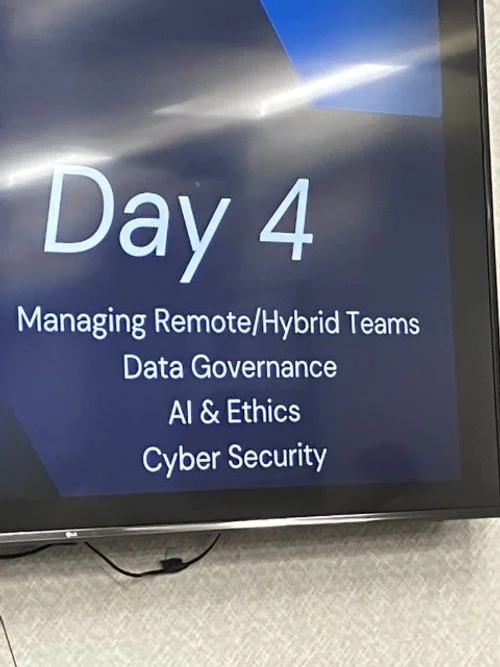

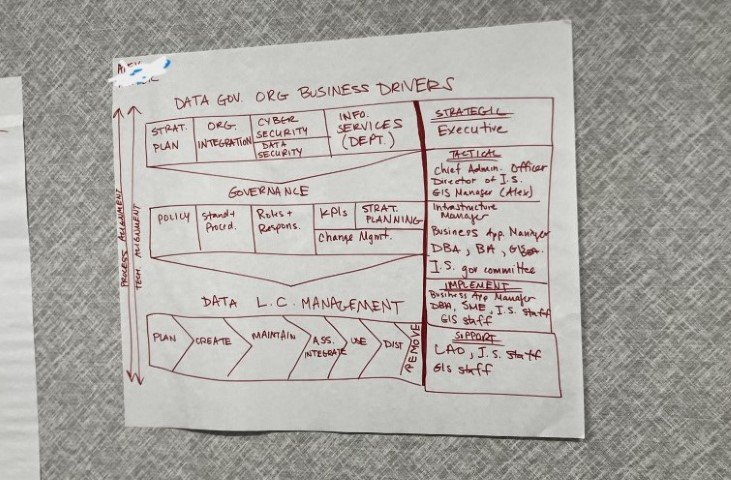
Value Stream Mapping
A method that helps visualize and optimize the flow of processes in our projects. It’s a powerful way to identify bottlenecks and streamline our workflows, ensuring that we’re delivering the best results with maximum efficiency. I’m already thinking about how to apply these concepts to enhance our project management at Maurer-Stutz.
Personal Kanban
Another session that really resonated with me was on Personal Kanban. I’ve played with Kanban before (pronounced however you pronounce “pecan”) This approach to managing tasks and workflows is both simple and effective, offering a visual way to prioritize and track work. It's about finding balance and focus, two things that can be challenging in our fast-paced field. I’m eager to get back to Kanban, not just for myself, but also to encourage my team to use it as a way to stay organized and reduce stress.
Additional highlights focused on:
Building and sustaining Effective teams even with remote members. Road-mapping a hypothetical GIS project as a group, providing clear near-term and long-term GIS initiatives. The Data Governance session highlighted the importance of establishing policies and standards regardless the size of the organization. Ans of course we discussed the Ethics of GIS projects emphasizing the impact of decisions on privacy and equity. These sessions reinforced my approach to building the MSGS department at Maurer-Stutz, where we are striving to integrate geospatial solutions seamlessly with our civil and transportation engineering projects as well as our own stream of projects.
It was just a great chance to connect with other GIS professionals and hear about their experiences. The discussions were real, down-to-earth, and incredibly valuable for someone in my role. Overall, the academy left me with fresh ideas and practical strategies that I’m excited to bring back to our team. If you ever get the chance to attend, I highly recommend it—especially if you’re looking to refine your leadership skills and get a better handle on managing your team and projects. I’m looking forward to applying these lessons as we continue to grow and evolve the MSGS department.